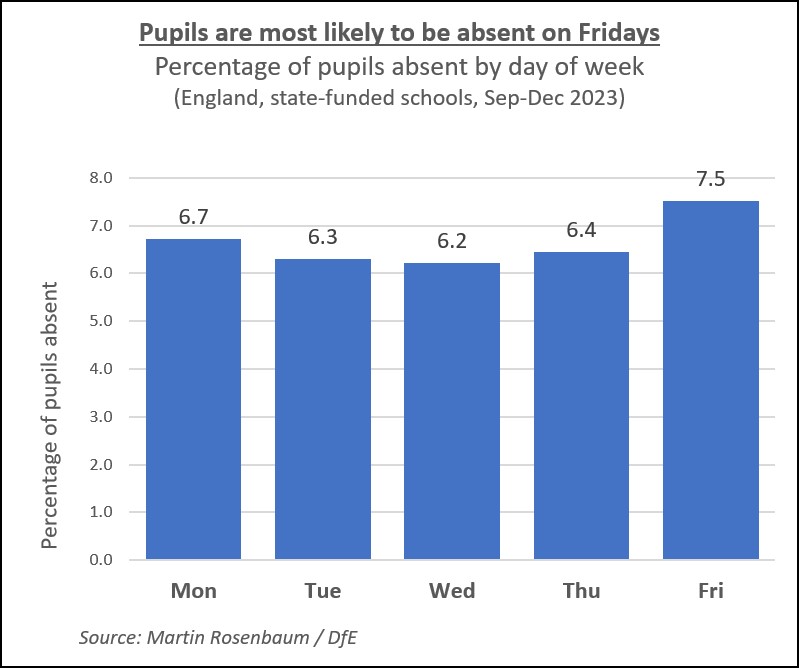
Pupils are over 20 per cent more likely to be absent from school on Fridays compared to Wednesdays.
The average rate of absence last term in England’s state-funded schools was 7.5% on Fridays. This compares to 6.7% on Mondays, the next most common day for school absence, and the lower figures for the middle of the week: 6.3% for Tuesdays, 6.2% for Wednesdays and 6.4% for Thursdays.
The issue of school attendance is moving up the political agenda, as levels of absence are now much higher than before the covid pandemic.
The government has today announced what it calls ‘a major national drive to improve school attendance’, with measures targeted at tackling persistent absence. The Labour party is also focusing on the issue this week.
This weekly pattern of absence being highest on Fridays, and second-highest on Mondays, with better attendance mid-week, is a widespread feature of the current school system.
From my analysis of the DfE’s data, it applies in both primary and secondary schools, and also in all regions of England.
It is seen when looking both at authorised and unauthorised absences from school. This includes applying to absence due to illness, which is the most common reason recorded for pupils not attending school.
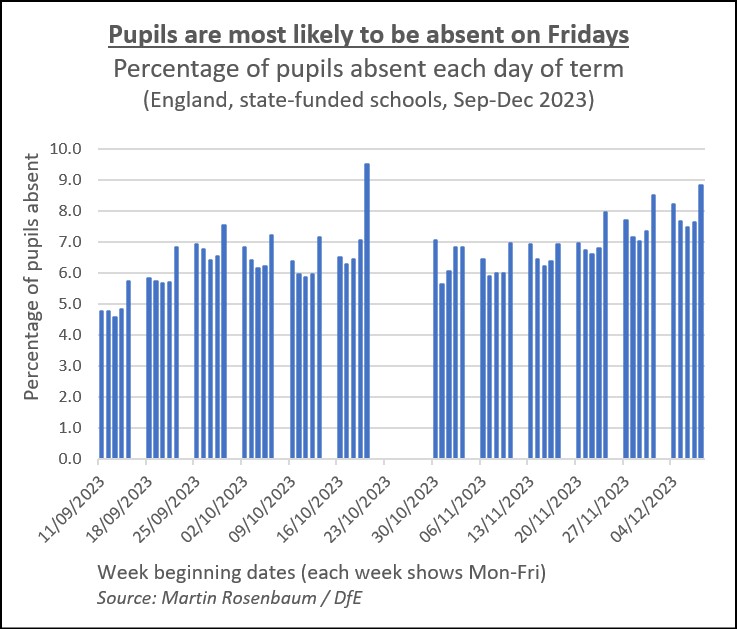
It was also evident throughout the autumn term, as can be seen in this chart (with a particular peak on the Friday before half-term).
The DfE’s data on school attendance can be downloaded here.
In a previous post I examined how school attendance can be affected by when in the year pupils are born.
For school pupils, does when in the year they are born affect how often they are absent from school?
My analysis of government data suggests that secondary school pupils born in September to December have a somewhat higher absence rate than those born in May to August – which is actually the opposite of what I expected.
Absence from school is now significantly higher compared to before the covid-19 pandemic, and tackling this has been made a target of government educational policy.
The data collated by the department makes it possible to quickly analyse a wide range of factors and potential connections with absences.
Since month of birth is definitely related to other aspects of school life, such as how well pupils do in exams and in sport – the so-called ‘relative age effect‘ – I decided to explore any link with school attendance. Through a freedom of information request I obtained pupil attendance data from the DfE for the school year 2022/23, broken down by type of school, school year and month of birth.
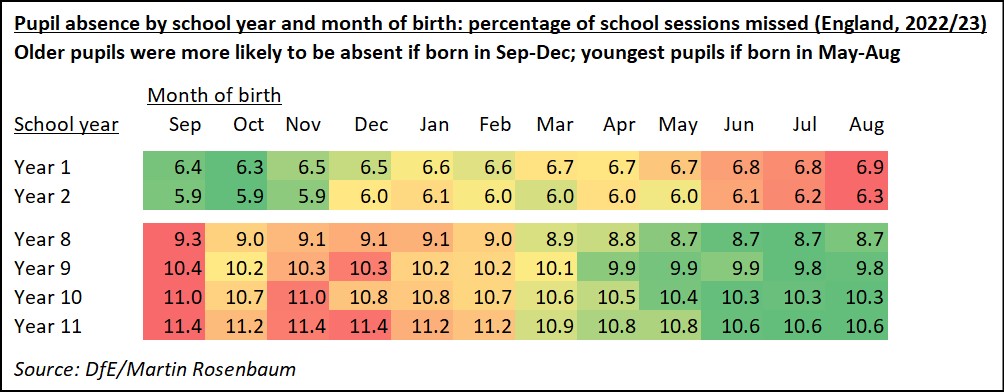
This table shows the percentage of school sessions missed by pupils in selected year groups. It shows that for pupils in years 1 and 2 (aged 5/6 and 6/7), it was the summer-born pupils who had higher rates of absence. This was what I expected, given the well-documented school problems often faced by summer-born children.
But for pupils in years 8 to 11 (aged 12/13 to 15/16), it was those born in September to December who were more likely to be absent.
However the differences within the year groups are not massive, so this pattern (while clear) shouldn’t be overstated. For the intervening ages the data showed very little variation within each year group, so I haven’t presented the figures here. I haven’t obtained data for the reception year.
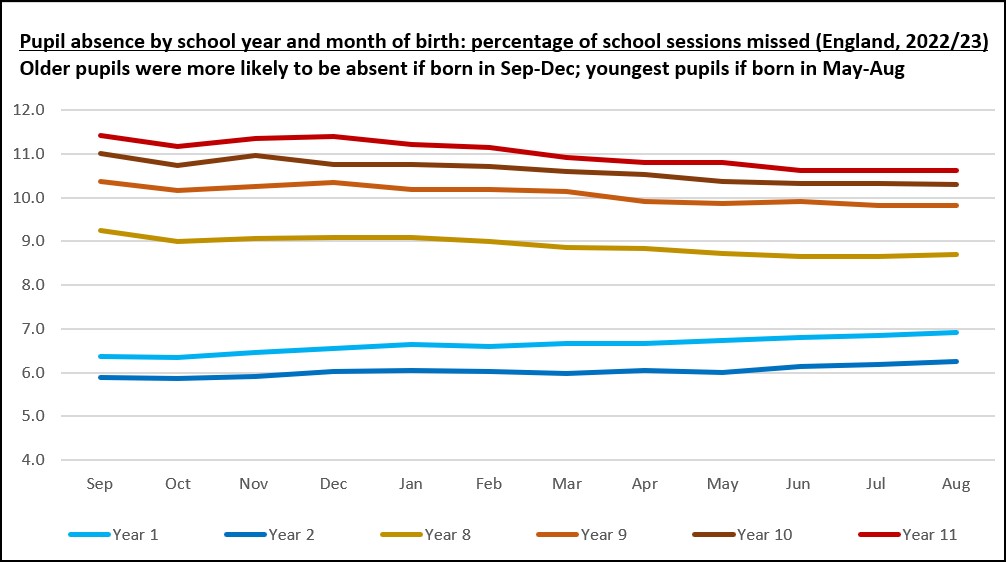
The following graph shows the same data presented in the form of a line chart.
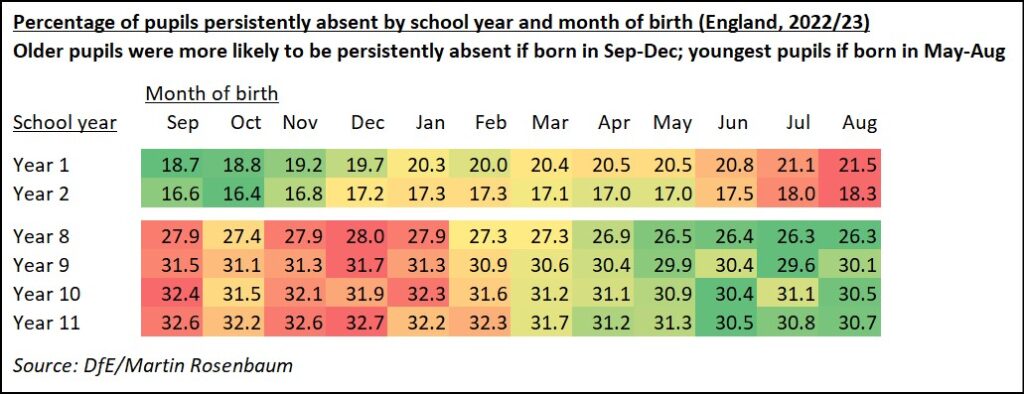
Persistent absence is a particular problem. This is defined as when pupils are absent for over 10% of school sessions. Analysing the data on persistent absence discloses a similar pattern.
This is indicated in the table below (which involves data from primary and secondary schools, but not special schools).
Generally rates of absence increase as pupils get older and move into higher year groups. Perhaps this trend could help to explain the fact that in secondary schools it’s the older pupils within the year group who tend to be absent more often.
But this can’t be a complete explanation – for example, the frequency of persistent absence is higher for year 10 September births (32.4%) than for the older pupils born in August and in year 11 (30.7%), and similarly for various other data points.
So it looks like there may be some kind of relative age effect involved here, if probably quite mild.
Bear in mind that this is just one year’s data, the period in the wake of the pandemic could be atypical, and there is also the possibility of random variation.
As another potential factor, some illnesses have been associated with when people are born within the year. However, this would not explain the jumps in this data between August and September births.
The DfE data distinguishes authorised and unauthorised absences, but this does not help much in explaining the pattern identified here.
It’s important to note that there are other characteristics which clearly have a bigger impact on school attendance, including levels of disadvantage (poorer pupils are more likely to be absent) and ethnicity (Caribbean and White ethnic groups have higher absence rates than Indian, African and Chinese groups).
The data spreadsheet supplied to me under FOI by the Department for Education is here.
For background on the government’s impressive automated collection of real-time school attendance data, you can watch a recent talk by Caroline Kempner, the DfE’s head of data transformation, given at one of the regular Institute for Government ‘Data Bites’ events (from 37’25” in the video).
It was hearing this presentation which prompted me to do this analysis.