My new book explaining in detail how the FOI system in the UK works and how to use it successfully to get information from public authorities is now published – available from Amazon here or direct via Rhododendron Publishing here.
The question everyone is asking today is surely this: What does our new prime minister think about freedom of information policy?
There’s not a lot to go on. Over the years he hasn’t expressed much interest in the topic, either in Westminster or in Manchester.
But one possible view of Andy Burnham is that he’s followed the standard politician’s trajectory of being keener on FOI when in opposition than in government.
This is nicely illustrated by the story of the Department for Health’s risk registers.
As a health minister in the previous Labour government, he declined to publish the departmental risk register, on the grounds that: “Putting the risk register in the public domain would be likely to reduce the detail and utility of its contents. This would inhibit the free and frank exchange of views about significant risks and their management, and inhibit the provision of advice to Ministers.”
But in 2012, having moved to opposition, he learnt to see the virtues of transparency. He now demanded the release of a Department of Health risk register relating to the then government’s NHS reorganisation policy. This was in line with ICO and tribunal rulings, which the Cameron coalition eventually blocked by use of a ministerial veto.
Naturally his new stance required devising arguments (of varying plausibility) as to why the issues surrounding this transitional risk register were completely different to those surrounding the strategic risk register previously withheld when Labour was in power.
On the other hand, back in 2007, in a free (unwhipped) Commons vote, he had opposed a measure to ensure that information about MPs’ parliamentary expenditure remained subject to FOI. He was thus one of a few dozen MPs who tried and failed to keep expenses details out of the public domain.
This was before the eventual publication of the extraordinary facts involved which created a massive political crisis in 2009, and in which he was caught up in a comparatively minor way.
However he has consistently promoted transparency on one topic, as part of his admirable personal commitment over many years to the cause of the Hillsborough victims and their families.
The Thatcher government’s response to the Hillsborough tragedy was a topic that I investigated using FOI around 15 years ago when I worked for the BBC. I talked to him about it at the time, he was keen to do so, and I can remember him telling me earnestly that “We’re on the same side”.1
More recently, as Mayor of the Greater Manchester Combined Authority he would have found himself and his office subject to FOI again.
The authority was rebuked earlier this year by the Information Commissioner’s Office for its failure to comply with the official code of practice on publishing FOI statistics. However it has to be said that this is a widespread problem amongst public bodies.
Burnham now takes national power at a time when earlier hints of government plans to constrain FOI appear to have been set aside.
I can’t see those possible restrictions reappearing in the near future. Apart from anything else, it would be tactically extremely foolish for the newly formed government, generating press antipathy and bad publicity. Those factors ought to feature on any decent risk register.
Assuming that FOI policy stays with the Cabinet Office, the cabinet minister directly responsible will be Louise Haigh, the new First Secretary of State and Chancellor of the Duchy of Lancaster, a close Burnham ally. She will generally have a very influential role within the government.
In opposition she did speak enthusiastically about FOI: “It has saved time and money and helped countless services improve for the better but crucially it has enshrined in law the right to know about the decisions being taken in our name. Make no mistake, we will fight to defend it.”
In particular she campaigned strongly for FOI to be extended to private contractors delivering public services, which would be an important strengthening of the law and the rights of citizens to information.
So we wait to see if ‘in due course’ has now arrived, or if alternatively things will seem different when viewed through the prism of holding power.
This was certainly more positive than my one conversation with Keir Starmer about FOI. I was talking to him at an event when he was leader of the opposition, and he asked me what I was doing now that I had left the BBC. I told him I was writing a book on how best to make FOI requests. He replied “Oh good, good”, in a tone that was acceptably polite but entirely lacking in enthusiasm, and then turned to talk to somebody else. ↩︎
The transcript of a recent podcast interview where I discuss how journalists use FOI, tactics, how the law should be improved, fighting tribunal cases, and some of my favourite stories …
I was interviewed by Ibrahim Hasan of ActNow Training, the information governance legal specialists, for his podcast series Guardians of Data.
This is a lightly edited transcript. (It was automatically generated, so may contain some minor errors). You can listen to the podcast here.
Ibrahim’s interviews with figures from the information rights world are very interesting, and I would strongly recommend the other episodes of his series.
Ibrahim Hasan
You spent many years using the Freedom of Information Act to produce quite impactful journalism. But I just want to go back to the beginning before FOI. What was it like to try and elicit information from public sector institutions, especially government?
Martin Rosenbaum
The key thing about FOI is that it gives you a legal right under certain circumstances to squeeze information out of people who might be reluctant to give it to you. That’s really from the journalistic point of view. Now, obviously, prior to FOI coming in, journalists did lots of stories about government. In some ways, it wasn’t very different, but there were certain particular stories that you couldn’t get because you didn’t have that legal right to get information out of public authorities. And that’s the key change that it brought about.
I wouldn’t claim that it transforms the majority of journalism, because for a lot of journalists, they actually use it very little if at all. And that’s a lot to do with the delay that is involved in using FOI. It’s not something for daily stories, it’s only for longer-term stories. But for those longer-term, more in-depth, more investigative stories, it’s a very valuable resource.
Ibrahim Hasan
Before the Freedom of Information Act came into force, there were other instruments or codes of practice which gave access to information held by government. What was it like working with those codes?
Martin Rosenbaum
I did make use of the access to government information code, the code of practice that existed, as you say, at the time. I think the first thing that has to be said about it is that hardly anybody knew about it. Certainly not many journalists knew about it, but even when you were saying to government departments or other public authorities, large ones, there’s this code of practice, I’m entitled to this information, you’d find a lot of people didn’t know about it.
I did actually write an article for the Press Gazette, a journalism trade magazine about this, before I worked for the BBC, where I’d asked lots of public authorities for very simple information under this code of practice on open government. I can’t remember now the number who didn’t reply or said that they knew nothing about it, but it was a very substantial proportion.
So that was one reason why the code didn’t really make much difference, because neither journalists nor public authorities were really aware of it. But the second thing about it was that if they didn’t want to give you the information, they could just ignore the code. There was no legal recourse, you couldn’t complain to the Information Commissioner, you couldn’t go to a tribunal. That was just the end of the matter because it was purely advisory. So I think the advisory code that existed before the actual Freedom of Information Act came into force really made very, very minimal difference to making government more open.
Ibrahim Hasan
So now you’ve got a statutory right to receive information, and of course, anybody can make a request for information. How would you say that FOI has changed the relationship between public authorities, journalists, and the public?
Martin Rosenbaum
So, as I say, it’s the legal right that counts, and you can sometimes squeeze information out that otherwise you wouldn’t have been able to, and public authorities are aware of that. So the relationship between journalists and public authorities, say when you’re dealing with press officers, is made different by that, because you might be asking a press officer for certain kinds of information, and previously you would know there was a brick wall you weren’t going to get beyond, but now the press office knows there’s actually a kind of route over the brick wall for certain kinds of information, although obviously we know there are lots of exemptions.
Sometimes press officers will give you that information anyway because they know you could get it under FOI. Sometimes they want to make you go through the business of doing it under FOI because of the delay. But it does mean that that kind of power relationship between journalists and press officers is tilted a bit in the journalists’ direction. And the same also applies not only to journalists, but also to all requesters, which might be campaign groups, they might be businesses, they might be individual members of the community, could be anybody who also now have this legal power which public authorities are aware of, which gives power to them as opposed to the public authority.
Ibrahim Hasan
So, Martin, over the years you’ve broken lots of stories using the Freedom of Information Act. Can you share a memorable story that stands out as an example of the power of the Freedom of Information Act?
Martin Rosenbaum
So one story in particular, amongst many, has stood out in my mind as encapsulating some of the benefits of freedom of information, although in some ways it’s quite a mundane everyday kind of story. It took me an 18-month dispute with an agency from the Department for Transport. But I eventually managed to obtain information about which makes and models of cars were most likely to fail their MOT tests. And I knew this information must exist because the government was collecting all this information from MOT garages. And I thought this information is of use to the public to know which cars have the best records, however old they are, how likely they are to fail MOTs or not. As I say, this was resisted by a Department for Transport agency, who said it would breach commercial confidentiality to release the information, it was damaging to commercial interests. My view was it’s overwhelmingly in the public interest for the public to have this kind of information. The Information Commissioner ruled in my favour eventually. So the information was actually published and this came out.
But the thing that I most like about this story is the fact that this information, which for 18 months the Department for Transport told me was too sensitive to reveal, is now actually published proactively every year by them as open data. It is now available to anybody on the internet all the time, updated every year as a matter of routine, despite the fact that there was this initial resistance to making it available. And that to me is really a kind of symbolic triumph of FOI, to take information which at one point was considered too sensitive to reveal, get it out there in the open, now it’s revealed routinely as a matter of course.
Ibrahim Hasan
Absolutely. Do you think that over the last 20 years now we’ve seen a culture change thanks to FOI, where organisations, particularly government, are becoming more open and more routinely publishing information, whereas previously they wouldn’t have done so?
Martin Rosenbaum
I think there’s been a mix, really. Things have gone in waves. Initially, when FOI first came into force in 2005 and the couple of years after that, there definitely was among some public authorities a kind of enthusiasm for it. They felt it was part of the mood of the times to put information out there. And I think there were more positive responses then to FOI than some of the responses that we would get later. And then I think enthusiasm diminished. They found FOI a bit of a nuisance, sometimes worse, sometimes very embarrassing.
Then I think under the Cameron government from 2010, there was big enthusiasm for open data, publishing a lot of stuff proactively, which is not necessarily the same information that people were actually asking for under FOI. It’s sometimes what the government wants out there rather than what the public wants to know. Nevertheless, they did push a lot of stuff out there, and also I think there was a kind of effect of galvanizing people a bit into actually thinking: we believe in open data. This again was the spirit of the times, that we should be releasing stuff. And that then has diminished since then.
So I think there have been waves, and different public authorities have taken different attitudes at different times. I don’t think one can say there’s been a total transformation in attitudes to openness and transparency amongst the public sector. That’s going too far, but there is certainly partial evidence of that.
Ibrahim Hasan
It’s interesting what you say about the Cameron government, that they went through a phase of so-called openness and transparency. If you remember the local government transparency code, I think it still requires all payments made by local authorities over £500, and there’s thousands of transactions. So sometimes the interesting bits can actually be difficult to find.
Martin Rosenbaum
That’s absolutely true. And I remember when this first started happening, and all these details of invoices and receipts and everything were published, looking through them for certain kinds of public authorities, and it was absolutely overwhelming. And unless you really knew what you were looking for, it was very difficult to find anything of interest.
Ibrahim Hasan
So you’ve shared your experience of making the request to the Department of Transport, and that was quite significant because it led to a different sort of approach on their part and publishing information now routinely. Any other surprising or personally significant discoveries you’ve made through FOI?
Martin Rosenbaum
Another one which I thought was important, and this again was after quite a fight, a letter which the then Prince Charles, now King, had written to Tony Blair when Blair was prime minister, lobbying him against genetically modified foods, which Charles was very unkeen on and he wanted Blair to meet people who would tell him how bad genetically modified foods were.
And this was a two-year battle with the Cabinet Office to eventually get hold of this, which again needed the Information Commissioner to rule in my favour. And also, this was actually, as I’m sure some of your listeners would appreciate, under the Environmental Information Regulations, which cover environmental information, because GM food comes under that, and they’re similar to FOI but not identical. And you couldn’t get this under FOI. It was only possible because it was under EIR.
But what that illustrated to me was with these regulations, you could get information which was going right to the heart of the top of government, the kind of innermost sanctum in a way, the communications which were going from the then heir to the throne to the then prime minister.
Ibrahim Hasan
But then, of course, Tony Blair was criticised at the time, they termed it sofa government, where his advisors would meet without records and they were just discussing and making decisions. Perhaps that was a downside of FOI, and we’ve seen that with the COVID inquiry as well, messages were deleted. Do you think that is the case? That freedom of information perhaps has led to, in some quarters, fewer records?
Martin Rosenbaum
So I think this is a complex topic, and there are different forces that point in different directions. And you’re right to refer to Blair’s sofa government, as it was called, but that actually was going on before FOI came into force. It was how Blair wanted to do things. And while it might be true that when FOI came in they did record even less, there were reasons why they were doing that anyway, because they liked to operate in that kind of way. It was his personal style.
And then taking the COVID inquiry and the WhatsApp messages, and there are WhatsApp messages from certain people, certainly in Scotland and Wales, saying we must delete these, and not everybody deleted them, and these actually ended up being presented at the inquiry. I think what we now have with WhatsApp and other chat apps is that information is now recorded in a certain way, written down, which previously would have been the kind of telephone conversation, the corridor conversation. And that is a big challenge in this context because they tend to be more informal conversations, potentially more embarrassing, sometimes anyway, not the sort of proper record keeping of state. And it means all this stuff is potentially perhaps available. It’s certainly become available to the COVID inquiry. You could put in FOI requests for it, some of it you would get and some of it you wouldn’t because of the exemptions.
But I think technological change and the way people now communicate with each other, and of course this may change in the future, but where we’re at now, has indeed made this whole thing about what is recorded and what is not recorded much more acute and difficult for a lot of people, I agree.
Ibrahim Hasan
Martin, you’ve made your craft FOI over the years. Let’s just unpack how that works in practice. Now, your book, Freedom of Information, a Practical Guidebook, gives readers a step-by-step approach in terms of making FOI requests. What would you say are the key tactics or key qualities of a good FOI request separating it from one which could just lead to a dead end?
Martin Rosenbaum
There are lots of points in a way to bear in mind about how to write effective FOI requests. But I think the core thing above everything else is really to think through very clearly exactly what you’re asking for and make sure that the words that you’ve put down in your email actually ask for it clearly and precisely. In other words, you specify it exactly, and there is no ambiguity in what you have asked for.
When I was at the BBC and I was advising other journalists on putting in FOI requests, they would come to me sometimes and say, Look, I’m really annoyed, I put in a request for this, I didn’t get it, I’ll show you the request and the answer. And sometimes I’d end up saying to people, Actually, you didn’t get what you wanted to get, but you did get what you asked for, because if you look for a literal interpretation of your request, that’s what they actually sent you. And so the key thing is to express it really clearly, specifically, and precisely, and to know what you’re trying to get.
Ibrahim Hasan
And let’s talk about that from the perspective of information governance officers who are dealing with requests from journalists. What are your tips?
Martin Rosenbaum
Information governance professionals, they do deal with journalists’ requests, obviously. And the good ones accept that this is part of a journalist’s job to obtain this information. It might sometimes be embarrassing or annoying or difficult or whatever for their organization, but legally the requirement is there that information has to be made available, and it is the journalist’s job in the public interest to get this out, and so it’s about following the law and complying with the requests and being reasonable and so on. I think good ones are fully aware of that and behave in that kind of way, sometimes meeting resistance from more senior people within their own organizations who aren’t happy about releasing stuff.
I think the other thing to bear in mind is to try and respect journalist deadlines, for example, if a request does need clarifying because it hasn’t been expressed very well. What’s really annoying and frustrating as a journalist is that someone contacts you on the 19th day after you’ve put the request in and says, Hang on a minute, what are you actually asking for here? When it’s perfectly obvious they could have done that after one, two or three days, come back to you and said, Actually, you’ve used the wrong phraseology here, please can you clarify? So making sure that things are done promptly is also very important.
Ibrahim Hasan
And what about communication as a journalist? Would you like somebody to come back to you quickly by email, or would you prefer them to just pick up the phone and talk to you?
Martin Rosenbaum
100% definitely pick up the phone. And one thing that has changed is I think it’s a bit harder now for those conversations to happen than they used to in the first period of FOI. And I don’t know whether that’s because people are more reluctant to be helpful. I don’t know whether it’s because people are under more time pressure. Or, as sometimes said, a younger generation of people in the office are less keen to talk to people on the phone in general, they prefer to send texts and so on, there’s been a generational shift in the nature of communication messaging, whereas older people are happier talking on the phone. Maybe even that plays a part, but whatever it is, it’s much better to have a conversation on the phone where you can discuss, this request I put in, does it actually make sense? Is it correct? Is the phraseology right? But also what is likely to be feasible within the time limit, how are the record systems structured and so on, so that a particular request can actually be processed feasibly.
And then you avoid the situation of people putting in a lot of requests which go over the cost limit, or end up with people searching record systems which it’s futile to search, or the records that are wanted aren’t really in those record systems. A lot of that pointless activity, which actually wastes time, both of the information governance professionals, also of the journalists, everybody involved, a lot of that wasted time could be avoided through phone conversations. And at the end of the phone conversation, you probably would say, okay, what we’ve agreed is such and such. We put that in writing because an FOI request has to be in writing. But it’s that phone conversation which facilitates a much more productive relationship, in my view.
Ibrahim Hasan
And I think having those relationships mean that sometimes it may be the case that journalists, rather than making a formal FOI request, just pick up the phone and ask for information. And so that reduces the burden for the FOI officers.
Martin Rosenbaum
Absolutely, yes. There’s lots of information which can be given out very easily without the need for a formal FOI request and the administrative and bureaucratic processes that they end up going through. I would always encourage journalists to try and have good relationships with FOI officers, and it works both ways from the journalistic point of view. Sometimes people would suggest to you actually, you could put in a request for such and such, which you hadn’t thought of and might be a very interesting request. But also sometimes I would be talking to FOI officers who would persuade me, and I think they were sincere, actually putting in a request for such and such, you might think is a good idea. It’s a waste of time because blah, blah. And it would save time.
Just to give one sort of particular organisational example of this, in the first few years of FOI, the Association of Chief Police Officers, as it was then, had this unit, this central FOI unit, who were actually really helpful in terms of you could phone them up and say, We’re thinking of doing this, and they would say, Well, the piece of jargon for that is such and such, or police forces don’t actually hold that information, so it’s a waste of time, but they might hold this information instead. Or they might say sometimes we would tell people not to answer that request, and we might say, Well, we’re going to do it anyway, and they’d say, Fine. But it was a perfectly straightforward discussion, which I think at the end of the day saved a lot of people time and aggravation. And that has all gone now in terms of the police, that kind of stuff doesn’t exist anymore. But where it does exist in public authorities, I think it’s really useful.
Ibrahim Hasan
I agree that picking up the phone is a good option. Now, just going back to your experience, Martin, you’ve taken cases all the way to the tribunal. What’s that experience taught you?
Martin Rosenbaum
I’ve taken quite a few cases to the tribunal, and I’ve won some and I’ve lost some, but I have to say that on the whole, I’ve been impressed by how the tribunal has dealt with cases, and where I have lost, I haven’t felt I’ve been treated unfairly in any way, and obviously where I’ve won, I don’t think that.
But I think one of the things that whole process has taught me is actually how with the FOI system, there’s so much value in persistence, there’s so much value in pursuing things that you don’t get at the first stage, and how often you get more information at subsequent stages. This is first of all at the internal review stage, often you get information you didn’t get at the first stage. Then when you go to the ICO, and I’ve talked about cases where the ICO has ruled in my favour. But even when the ICO doesn’t, taking a case to the tribunal, you’ve got a reasonable chance if you’ve got a good case of getting information at the tribunal stage which you didn’t get before. At all these stages, there’s a reasonable chance of getting information you didn’t get initially.
Partly, I think, because people have imposed exemptions in too blanket a way at earlier stages. And the more stages you go through, often the more granular the detail in which the information is assessed as to what should be released and what shouldn’t be released. There’s more scrutiny at a later level.
So I think the fact that we can take cases to a tribunal in this way is a very good thing. And I’ve done these representing myself. I’m not a lawyer, but obviously I do have good knowledge of FOI law and some experience now of dealing with cases at the tribunal level. And I think it’s perfectly feasible for individuals to represent themselves and to present a good case to the tribunal and sometimes win. And it’s a good feature of the FOI system.
Ibrahim Hasan
Can you give us some examples of victories at the tribunal that you’re particularly proud of?
Martin Rosenbaum
One which was quite recent, and this was since I left the BBC, was the nomination that was given by Boris Johnson for two peers, Charlotte Owen and Ross Kempsell. And I wanted to see the citation, the reasons that were given for why these people had been made peers in the House of Lords, where they actually have the right to vote on legislation, they have political power, they’re voting on laws that all of us then have to obey. What were the official reasons that were provided by Boris Johnson as to why they should be in the House of Lords?
Ibrahim Hasan
Yes, Charlotte Owen was a particularly controversial one, wasn’t it? Because she was so young and it seemed that she had very little experience.
Martin Rosenbaum
Absolutely, so there’s nothing really in her CV that pointed to the level of seniority or authority or experience which would suggest that she is someone who should be in the House of Lords. This initial request was turned down by the House of Lords Appointments Commission. It was turned down by the ICO who went against me. But the tribunal ruled that this information should be released in the public interest, which I think is absolutely the right decision. And the reasons that were given for why she should be in the House of Lords were really very, very thin indeed, and didn’t amount to, in my view, justification as to why she should be someone who is making laws for the rest of us. So that took a long battle, but it seemed to me absolutely that the public should know why people are being made into legislators, and the tribunal took the right decision in the end.
Ibrahim Hasan
So it’s been around for over two decades now, Martin. Now, with open data dashboards, AI-driven systems, what do you see as the new challenges or opportunities when it comes to FOI?
Martin Rosenbaum
I’m sure AI, in the same way it’s going to affect everything, will affect the world of FOI. I know FOI officers talk about how they’re already reading FOI requests that have clearly been written by AI, and we’re seeing some evidence of an increase in numbers of FOI requests.
Ibrahim Hasan
I read the post on LinkedIn from the Scottish Information Commissioner. He’d seen a massive increase in appeals and requests as well. And partly he was saying it was as a result of ChatGPT and other generative AI solutions making it much easier for people.
Martin Rosenbaum
Yeah, and I did a survey of various other complaints bodies, ombudsmen, say, the financial services ombudsman and the housing ombudsman and things like that, so outside FOI, but also complaints bodies. And amongst them, over the past few months or so or a year, there’s evidence of increasing numbers of complaints, and it makes absolute sense. People enter into ChatGPT, how can I complain about this? And ChatGPT says, this is what you do, and would you like me to write your complaint for you? It makes everything so simple. So it’s undoubtedly leading to more complaints, more FOI requests, and so on, which will I’m sure for some public authorities create an issue.
But also public authorities themselves are talking about and thinking about how can they use AI in order to try and process all sorts of incoming questions, including FOI requests. How can they get more productivity out of AI systems and use them more efficiently than their current systems? So there’s AI on both sides of the fence there. How that will work out in due course obviously remains to be seen. We don’t yet know. I think it’s very difficult to predict, but clearly AI will have quite a considerable impact on both sides of the FOI operation for sure.
Ibrahim Hasan
And where do you see FOI going forward in terms of how it develops? What change would you, as a journalist, want to see?
Martin Rosenbaum
One thing I would very much like to see is that FOI is extended to private companies who are delivering public services. Because obviously, what we’ve seen over the past 20 years or so is a big programme of outsourcing where a lot of public services, all sorts of different kinds, at the local level particularly, are delivered by private companies. Those private companies are outside FOI, and the government has indicated a loose kind of way that it’s planning to bring them within FOI.
Ibrahim Hasan
Obviously, when they couldn’t do anything about it, they used to make a big play about housing associations and PFI contractors, but we’ve not heard anything in terms of actual legislation.
Martin Rosenbaum
Exactly correct, no time scale has been provided for this, it’s certainly not an immediate priority. Whether it will happen or not, therefore, I don’t know. On housing associations, actually, this is something that the Conservatives were doing and Labour has continued with, they’ve introduced a kind of partial information rights law which gives residents of housing associations rights to information about the functioning of the housing association. It’s not an FOI law in the sense that anyone would have that kind of information. But you’re right, absolutely right. This is something that they’ve talked about for a long time. We don’t know when it will happen. We don’t really know if it will happen, but I do think it would be a very important reform if it did.
Ibrahim Hasan
And perhaps a time limit on when a public authority wants clarification, so that as you said earlier, they don’t wait 19 days.
Martin Rosenbaum
Absolutely. What the law actually says is that people should deal with FOI requests promptly, and the 20 working days is a kind of backstop. So prompt is a difficult word to enforce, but I think public authorities should comply with the law and be prompt rather than leaving everything to the 20 working days.
Ibrahim Hasan
So finally, Martin, I’ve had a look at your book, Freedom of Information: a practical guidebook, an excellent piece of work. What inspired you to write the book, Martin?
Martin Rosenbaum
What really inspired me was I’d spent over 15 years at the BBC, as the leading specialist in BBC News, in putting in FOI requests, training other journalists in how to do it, advising journalists from other programmes who would come to me and talk about what they were doing, and so on. And I felt, first of all, that I had a great deal of experience and I’d learned a lot during that 15 years. And what I really wanted to do was actually put that down on paper in order to help others so that I could communicate the benefits of what I’d learnt. And also because of the way in which people had come to me and asked for assistance, I thought I had a pretty good idea of some of the pitfalls that other people had been falling into, what they needed to know to avoid falling into those pitfalls and to ask better requests in future. And overall, really what I wanted to do, I wanted to write the book, which, if it had I’d been able to read it when I had first started out, would have saved me from so many problems, so many things that I myself got wrong in that kind of learning process, because it encapsulated all the experience of learning how to do things better.
You can buy Freedom of Information: A practical guidebookhere.
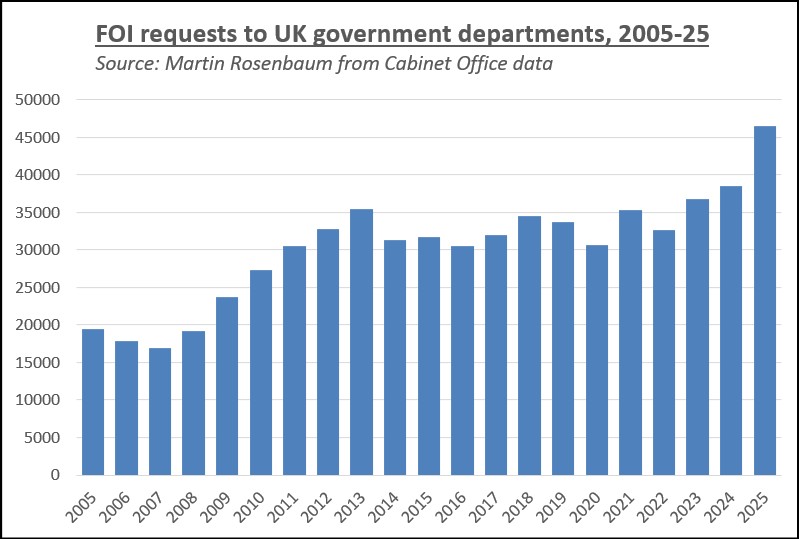
The number of FOI applications to departments reached 46,545 in 2025, up from 38,536 in the previous year. This included particularly large increases for the Home Office and the Department of Work and Pensions.
This chart shows the figures for FOI requests received by UK government departments since the law came into force in 2005.
Clearly there are many reasons for why people submit FOI requests, but I belong to the camp who think that one cause of the jump is probably the use of AI. When people seek advice on their problems with parts of the state, chatbots may suggest making FOI applications and indeed offer to draft them to make the process easier.
I’ve previously analysed how numerous national complaints bodies are now receiving a greater quantity of cases.
In this way AI is helping some people to discover their legal rights and also assisting those who are less confident or knowledgeable about how to assert them.
However one problem for FOI officers on the receiving end is that AI-generated requests are often not well targeted or phrased. Although their quality has improved, nevertheless as with much AI writing they tend to be verbose and typically may contain multiple overlapping questions, asking for similar material in slightly different ways.
While it’s possible to write prompts to try to avoid this, the people who would be good at constructing those prompts are probably not the same as those who are only making FOI requests now because AI has shown them how to do so.
(If you’re looking for help on drafting a better FOI request, I would of course suggest that instead of consulting an AI, you would get much more beneficial advice from my book – Freedom of Information: A practical guidebook.)
Note that these statistics only cover UK central government and so these requests only constitute a small proportion of the FOI applications submitted across the public sector.
Ongoing research by Ben Worthy of Birkbeck College, University of London, into local government and FOI is producing findings that are consistent with this notion of some increase in requesting linked to use of AI.
These figures have come out in the wake of reports that the government is currently considering measures to curtail FOI. An article in the Financial Times last month suggested there are discussions about reducing the cost ceiling, so that more requests would be rejected as too expensive.
Another piece described fears within government that FOI is being used by agents of hostile states and China in particular to obtain unclassified details which could be pieced together to reveal more sensitive defence and security information.
In response journalists and campaigners have pointed out that cutting the maximum cost probably won’t save much money, that public bodies could make FOI savings in any case by actually being more open and less obstructive, and that worries about ‘jigsaw’ disclosures are already catered for under existing law. A useful piece by Julia Cushion of mySociety, which runs the whatdotheyknow website, has collated some good articles, including ones by George Greenwood of the Times, Jenna Corderoy of Democracy for Sale, and Claire Miller, as well as Alex Parsons of mySociety.
I’d also draw attention to this insightful piece of analysis by Ben Worthy.
Any attempt by government to restrict FOI will be strongly resisted by the media. Whether or not more does come of this remains to be seen
In my view FOI expenditure should be money well spent, because of the increased transparency and accountability of the public sector, as well as important specific benefits that follow from particular disclosures.
FOI involves some cost to the public sector, but it can also save large sums by deterring wasteful and unnecessary use of resources.
For some public authorities I have dealt with, it is clear to me they could save money by being more efficient and less obstructive.
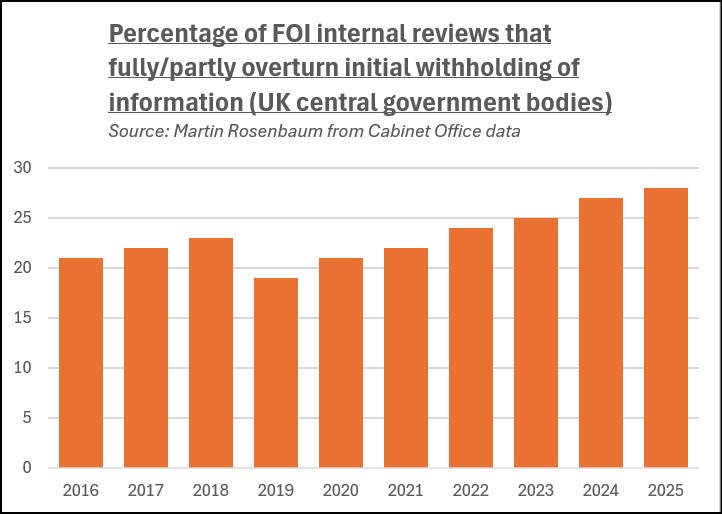
And in this context there is some other very interesting data in the latest government statistics. The proportion of internal reviews which partly or fully overturn initial withholding of information has risen again and now stands at 28%.
This is why on my FOI training courses I always advise that if you have a decent case then it is worth asking for an internal review.
I believe there’s a problem of incentives. In some public bodies, FOI officers feel they could get in trouble for releasing information, but they don’t get much blame for withholding material in a way that is later overturned. So if in doubt, they withhold. This results in unjustified rejections, many more internal reviews and much more time of senior staff being wasted on carrying them out – and it’s a task which those staff often resent. Authorities that want to be more efficient need to change this pattern of incentives for front-line FOI officers.
Complaints to the ICO and tribunal cases can eat up even more time of senior staff and legal advisors. Authorities which find themselves going through these processes because they have been unhelpful at the first stage may end up wasting a lot of public money that could be better spent elsewhere.
One fairly recent example (as revealed by Jenna Corderoy) is the Cabinet Office spending £15,000 on legal fees in an unsuccessful attempt to stop me discovering reasons Boris Johnson provided to the House of Lords Appointments Commission to justify peerage nominations.
Notes
For comparing trends in numbers of requests over time, I use the figures for government departments, rather than for all the central government bodies whose statistics are collected by the Cabinet Office. That’s because in recent years the figures for the non-departmental bodies have been distorted by a spike of very high volumes of requests to the National Archives for historic service personnel records. Previously these files were held by the Ministry of Defence, who treated applications for them as business-as-usual rather than FOI.
Statistics about FOI requests to other public bodies are not collected centrally in England, Wales and Northern Ireland. Larger authorities with over 100 staff are meant to publish their figures under the Cabinet Office’s code of practice, but many don’t. The Information Commissioner’s Office has recently started cracking down on this, issuing practice recommendations to some authorities, but there’s a long way to go before there is general compliance.
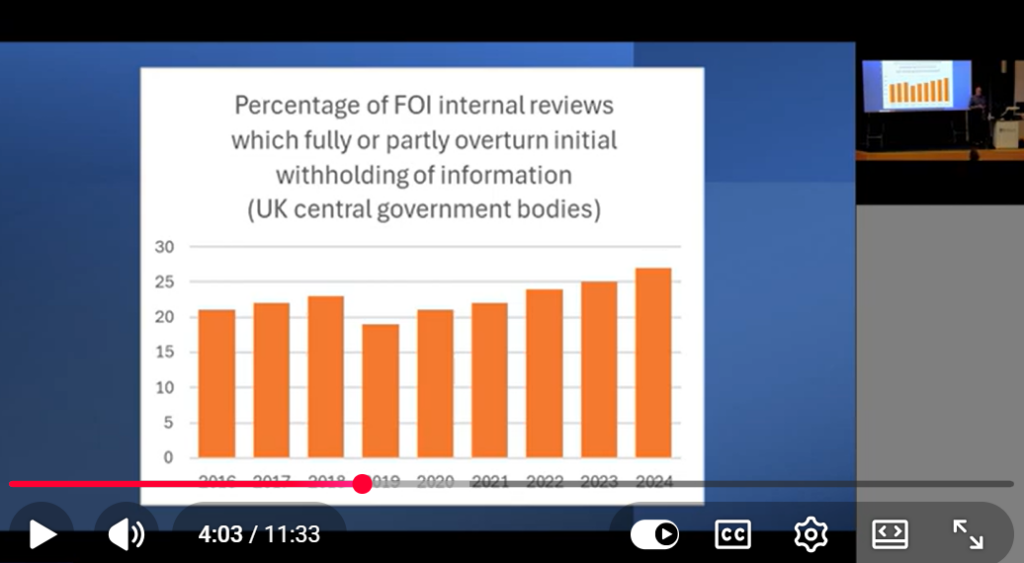
Here is my 10-minute talk from the FOI Fest conference – It’s a quick tour of some FOI lessons I have learnt – about persistence, phraseology, timing and the FOI requester’s Venn diagram, with a positive note at the end!
New disclosures from the National Archives reveal how ministers and officials struggled with the freedom of information system when it came into force in 2005.
“This is becoming a real problem” – that’s what a top Downing Street adviser told prime minister Tony Blair about FOI, just a few weeks after the law to open up the state to more scrutiny had come into force at the start of 2005.
Government files just released by the National Archives shed new light on how ministers and officials in Blair’s administration coped with the new public right to make requests for government documents, with their reactions varying from compliance through unease to outright hostility.
This particular memo was written in February 2005 by Jonathan Powell, who was then Blair’s chief of staff and today is still at the heart of power, as the current government’s national security adviser.
He told Blair: “The system is beginning to seize up – Private office, duty clerks etc – costing us nearly £20,000 a week. It is the same across government, and we need to do something.”
The prime minister replied: “What is the solution?! I need a recommendation”.
The government clearly found some of the initial rush of requests to be uncomfortable. In the following year they proposed new regulations to make it easier to reject FOI applications, but these plans met a lot of opposition and were abandoned.
Several years later, after he left office, Blair complained in his memoirs that civil servants had failed to warn him of ‘the full enormity of the blunder’ that in his view FOI proved to be. Powell also was later publicly critical of FOI, writing that ‘policymaking, like producing sausages, is not something that should be carried out in public’.
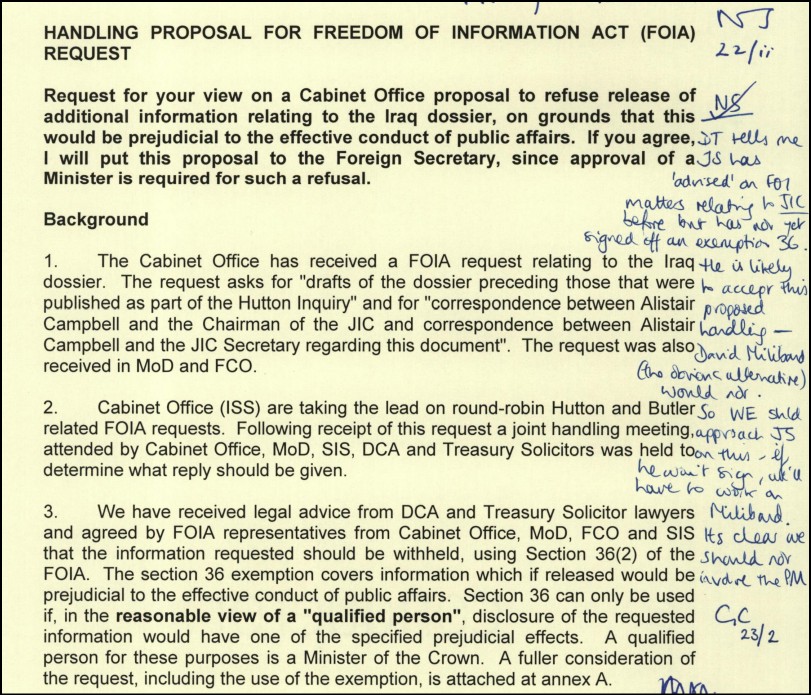
These files, which have been published under the 20 years rule for releasing old government records, also show how civil servants dealt with some of their first FOI cases.
They reveal how officials who did not want to release certain material relating to the Iraq war discussed which minister to approach for sign-off. They decided to ask the Foreign Secretary Jack Straw as they expected he would agree with their planned refusal, as opposed to the Cabinet Office minister David Miliband who they thought would not go along with this. An official added that if Straw wouldn’t comply, ‘we’ll have to work on Miliband’. Straw did.
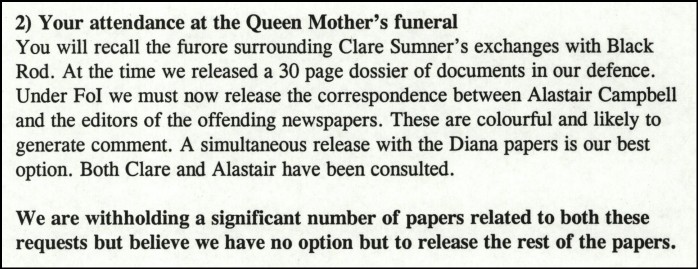
Other examples provide evidence of reluctant information releases which were enforced by the FOI law, as in this memo which an official sent to Blair.
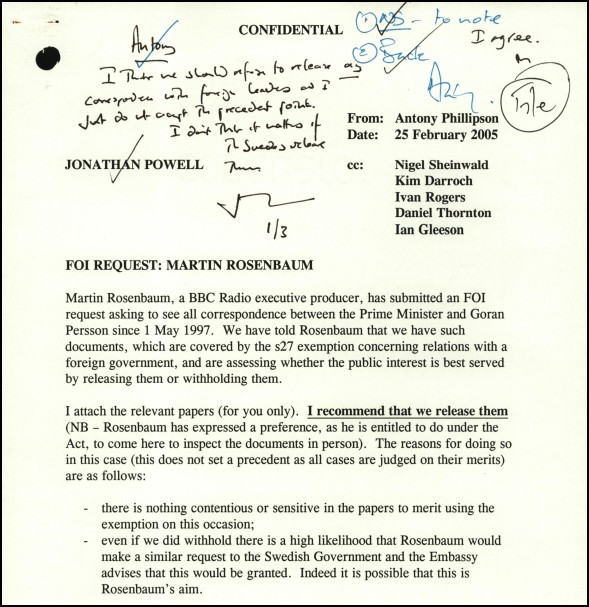
I was particularly interested to find discussion of how to respond to one of my early FOI requests – for correspondence between Blair and the Swedish prime minister, Goran Persson. I’d already obtained some of this from the Swedish government, which had a greater culture of openness, and wanted to see what Downing Street would supply in comparison.
Blair’s private secretary for foreign affairs, Antony Phillipson, recommended giving me the material, which he said contained nothing contentious. But he seems to have been overruled by the chief of staff, Jonathan Powell, who was worried it would set a precedent. Powell wrote that he was opposed to releasing any correspondence with foreign leaders.
So this information has now finally been released by the UK government over 20 years after the Swedish government disclosed it.
It includes the letter Blair sent to Persson to say ‘thank you for Sven’. This was in the wake of the England football team beating Germany 5-1 in the World Cup qualifiers in 2001, an early triumph for the side’s new Swedish manager, Sven-Goran Eriksson.
I was once told by the then Information Commissioner Richard Thomas that Downing Street staff had informed him that they couldn’t send me this amusing but harmless brief handwritten note, which I had written about for the BBC after I obtained it in Sweden, as they hadn’t kept a copy of it. Yet funnily enough, here it is in their files.
The released documents also show that many ministers were particularly exercised about FOI requests for their diary information, such as who they had held meetings with.
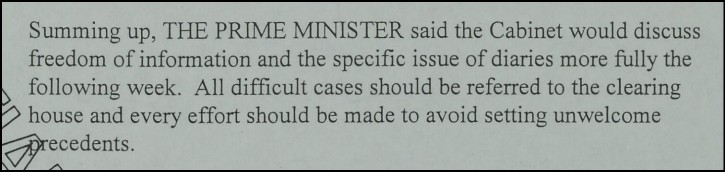
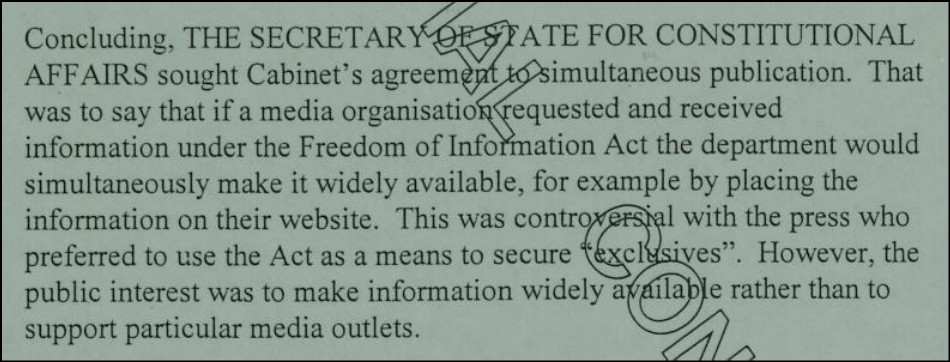
Policy on this was discussed extensively in correspondence between departments. The topic also featured prominently in cabinet meetings during the early months of FOI, as is disclosed in the 2005 cabinet minutes which have also just been released.
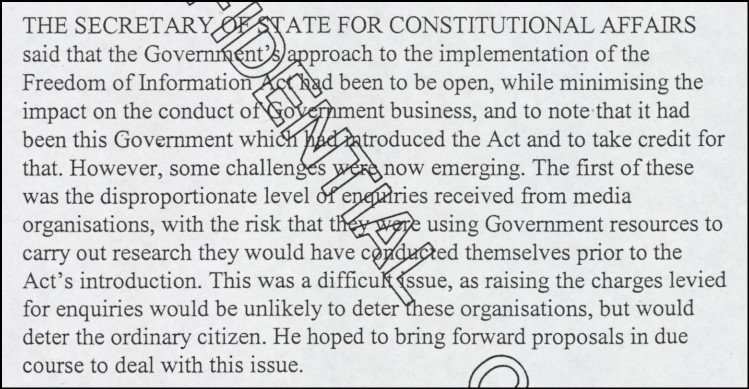
The cabinet minutes also give a broader view of how the new FOI system was regarded within ministerial circles, often with concern rather than pride.
It is interesting to note that the cabinet minister responsible for FOI, the Constitutional Affairs Secretary Lord Falconer, was keen to get departments to publish FOI disclosures on their websites at the same time as giving the information to the requester. This was particularly in the case of the media.
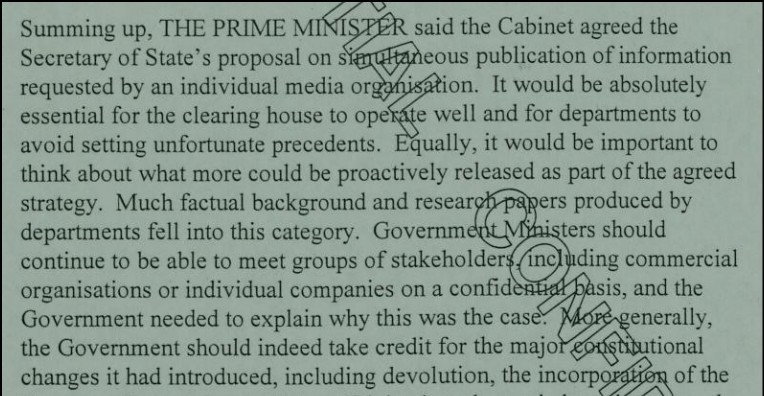
And finally, just before FOI came into force, this is how Tony Blair summarised matters to the cabinet, several years before he announced he was a ‘nincompoop’ for introducing the law.
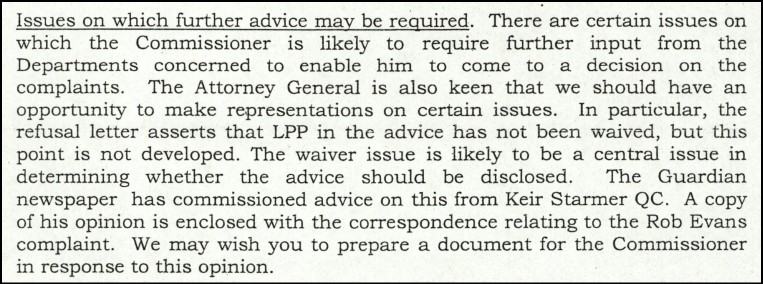
And one more thing. I wonder what Keir Starmer was saying back in 2005, in a legal opinion commissioned by the Guardian, on whether certain government legal advice should be disclosed.
What does a recent Scottish local government by-election tell us about the prospects for anti-Reform tactical voting?
Could anti-Reform ‘tactical voting’ block Nigel Farage from becoming prime minister?
Analysis of last month’s Caerphilly by-election for the Welsh Senedd suggests it was a significant factor in Plaid Cymru’s dramatic victory, with supporters of other left-wing parties voting for the Plaid candidate to ensure that Reform was defeated, as polls indicated only these two parties had a chance of winning.
And this month a YouGov poll covered in the Times reported that around half of LibDem and Green supporters would be willing to back Labour to stop Reform taking their constituency.
But to make a much bigger impact, left-wing voters would also have to be ready to vote for the Tories to keep Reform out – and the YouGov poll suggested that a significant minority would indeed do this: the net figures given were 30% of LibDems, 28% of Labour supporters, and 18% of Greens.
Discussion of tactical voting can be misleading. Most voters don’t really have a carefully ordered, fixed hierarchy of party preference in the way that some political punditry assumes. But the key point is that substantial numbers would appear more determined to block a party they really dislike rather than elect a party on which they are particularly keen.
According to the leading psephologist Peter Kellner, tactical voting along these lines in a general election could deny Reform 100 seats in England. Of these, 52 seats would instead go to the Tories, 44 to Labour, and 4 to the LibDems. A scenario like this would dramatically reduce Reform’s chance of winning an overall majority.
Given this background, it’s interesting to examine a by-election last week in a Scottish local government area, Stranraer and the Rhins. The ward is part of Dumfries and Galloway Council, and incidentally happens to contain Scotland’s most southerly point, the Mull of Galloway.
The conditions in this by-election turned out to constitute a kind of natural experiment about the extent of anti-Reform voting.
This is a location of traditional Conservative strength, and the by-election was narrowly won by the Tory candidate, just beating the new challenge from Reform.
It’s revealing because Scottish council elections are held under the single transferable vote (STV) system, where voters list candidates in order of preference.
At each stage of counting the votes, the candidate with the smallest number of preferences is eliminated, and the next preferences indicated by their voters are then allocated accordingly among the remaining candidates, before the next elimination.
This means we can gather information about the second or lower preferences of voters – and actual voters taking part in a real election, rather than respondents to a poll who are making predictions about how they might vote in hypothetical circumstances.
Whatever its merits as an electoral system, STV is certainly a boon for political analysts.
In this by-election the Reform candidate John Roberts was ahead at every stage of the count until the concluding one, when he was finally overtaken by the Conservative candidate, Julie Currie, who won by 42 votes, with 1565 to Reform’s 1523.
At the first stage Roberts had been leading with 1386 first preferences compared to Currie’s 1302. Then during the count Currie gradually caught up a bit at nearly every stage due to allocations of preferences as other candidates were eliminated, eventually nudging ahead to win thanks to the lower preferences passed on from the third-placed SNP candidate.
As the LibDem, Green, independent, Labour and SNP candidates were all knocked out, and lower preferences were transferred, the cumulative effect was that Currie obtained an additional 263 votes for the Tories, while Roberts only put on 137 more for Reform.
In other words 66% of these lower preferences transferred to the Conservatives and only 34% to Reform. This pattern was broadly consistent for each party eliminated during the count. And it was enough to ensure – narrowly and only at the last moment – that Reform lost and the Tories won.
This might seem to confirm the potential for such anti-Reform tactical voting for Conservative candidates by some on the left. But there are also some powerful pointers in the other direction.
Firstly it’s notable that about one in three of these voters actually preferred the Reform candidate to the Conservative, so the pattern of preference is far from universal. Nor is this at all surprising, given that Reform has been picking up support from across the political spectrum.
But perhaps more importantly, there were 852 supporters of these other candidates who in the end did not express any preference between Conservative and Reform. Thus overall, in what was clearly a two-horse race between the Tories and Reform, just 21% of the other voters preferred the Tories, and 11% Reform, so that the eventual net benefit to the Tories consisted of 10% of these others.
And this in a contest where due to the electoral system voters could still happily put their top preference first, while preserving the political impact of their lower preferences, without any need for the reluctant compromises of tactical voting.
This pattern is therefore significantly weaker than the picture which emerged from the YouGov poll. It could suggest that 10% is a reasonable upper limit for the proportion of left party supporters who might vote Tory to block Reform in seats where they are the two parties in contention.
On the other hand, 10% (or any figure close to it) is certainly not nothing. In a general election any degree of tactical voting by leftists for Tories to that sort of extent would be enough to affect some Tory versus Reform battleground seats and possibly the overall national position.
There are lots of caveats about all of this, naturally. While this was an actual election, it only consists of one local ward with about 4,000 voters taking part, in Scotland, under a different voting system, and could be completely unrepresentative. Not least, there may of course be all sorts of specific factors to do with the individual candidates and the local campaign, of which I am unaware.
And, in terms of the incentives to vote tactically, it must be said that even for many voters who are very uneasy about Reform, the prospect of a Reform candidate being elected to Dumfries and Galloway Council is not quite the same as the prospect of a Farage government.
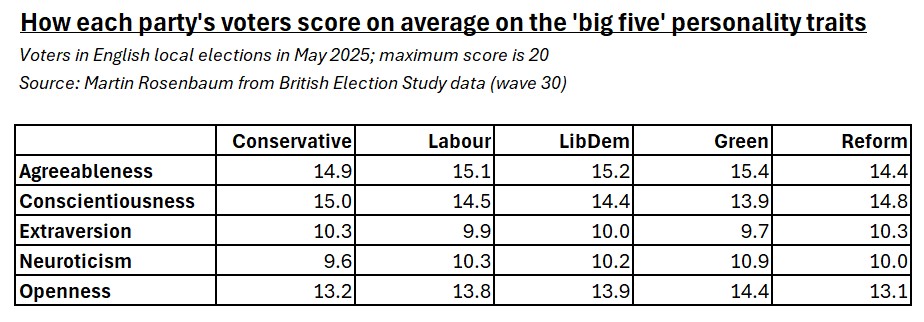
Research data suggests that, in terms of their personalities, Reform voters are on average the least agreeable, while Green voters are the most neurotic.
As for their pastimes, Greens seem to enjoy going for country walks and Tories doing the gardening, while Reform voters do not like watching BBC news.
And in terms of shopping, Morrisons appears to be the large supermarket chain with the most politically representative clientele.
The BES is a long-running academic research project involving extensive surveys of voting patterns, political attitudes, and demographic and social characteristics.
In the past week or so I have read three substantial pieces of political analysis which rely on the latest BES samples, by Ben Ansell of Oxford University, James Breckwoldt of Manchester University, and Dylan Difford of YouGov.
They are revealing and thought-provoking articles about parties and social class, the traits and attitudes of Reform supporters, and how public opinion has shifted in the past year, and I recommend them all.
However it is also possible to find amongst the riches of the BES datasets some minor gems, which are perhaps less politically significant but are nevertheless intriguing in their own way. So I’ve been looking at the most recent BES sample (wave 30).
When I refer here to voters for a particular party, that is based on how survey participants (sample size of over 6,000) say they voted in the May 2025 local elections in England, which saw major advances for Reform.
Personality
If different humans have different personal dispositions towards, for example, behaviours like self-reliance, trust, flexibility, boldness, anxiety, diligence, and so on, then (whatever the difficulties in measuring these) it is not surprising if features of this kind have some influence on political attitudes, as one factor among many.
The latest BES survey contains scores for aspects of the personality of respondents, tied to the so-called ‘Big Five’ psychological traits: agreeableness, conscientiousness, extraversion, neuroticism and openness.1
These ratings are based on the participants’ answers to a battery of questions aimed at identifying those broad characteristics.
Not everyone agrees this is a valid model of human nature or that self-completion is a reliable method of assessment, but it is dominant in the field of personality psychology and widely used in commercial and academic research.
This table shows the average score for each party’s voters on a scale for each of these personality dimensions. The maximum score in each case was 20.
The variation shown here isn’t massive, and the sample sizes for the party breakdowns aren’t very large. But the overall pattern is consistent and fits well with previous research on the same subject: right-wing voters tend to be more conscientious and extravert, left-wing voters tend to be more agreeable, open and neurotic.
What’s different here is that in the past in Britain this was mainly a Conservative vs Labour contrast. The rise of other parties means that we can now see these tendencies particularly sharply in Reform and Green supporters, who are likely to be especially right-wing and left-wing respectively and appear to have the personality characteristics to go with it.
So Green voters seem to have the highest average ratings for agreeableness, openness and neuroticism, and the lowest ones for conscientiousness and extraversion.
Reform voters tend to score the lowest on agreeableness and openness. It’s the Conservatives who register the highest scores on conscientiousness and extraversion, and the lowest on neuroticism, while Reform voters are second in each case.
The average personality ratings for Labour and LibDem voters are very similar to each other and middling.
Bear in mind that all these numbers here are averages – there is a lot of scope for individual variation.
Activities
The BES has also asked survey respondents a collection of questions about what leisure activities they participate in.2
The results suggest that Green voters are the most active in all sorts of ways, which may reflect their younger age: as well as country walks, this includes attending gigs and going to the gym, and perhaps more surprisingly even eating at McDonalds.
Reform voters seem to be much less active generally, at least in the sort of pastimes that social scientists like to ask about. However Conservatives apparently enjoy visiting stately homes as well as gardening.
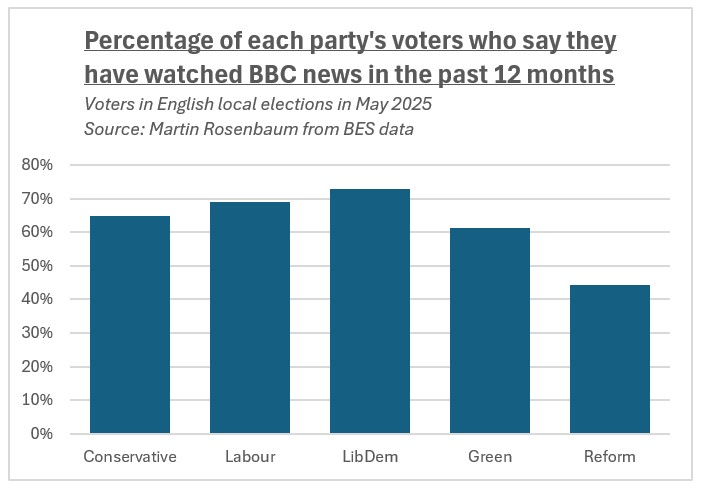
But in my opinion the most interesting and revealing comparison between the activities of different party supporters lies in who watches BBC news.
This shows how Reform voters are much less likely to be getting their news from the BBC.
Only 44% of Reform voters said they had watched BBC news in the past 12 months, compared to 61% of Greens, 65% of Tories, 69% of Labour voters and 73% of LibDems.
Supermarkets
There’s also a BES question about which supermarket respondents use for most of their food shopping,3 and there are some political differences in the answers.
So 30% of Reform voters say Tesco, compared to only 17% of Greens. However some shopping preferences are shared by these two groups: 21% of Greens and 19% of Reform voters do most of their shopping at Aldi, compared to only 11% of LibDems.
The most politically balanced large supermarket chain seems to be Morrisons. This is favoured for most of their food shopping by about 6-7% of each party’s voters.
I don’t know if the chance to chat with a good range of fellow customers counts as another reason to shop at Morrisons, but if so it’s another useful by-product of academic research.4
Notes
1 See p14 of the survey documentation; the sample size for this is 3,077. By the way, if you find any of this personality terminology to be annoyingly judgmental about human characteristics, don’t blame me, I didn’t invent it.
3 See p649 of the survey documentation; the sample size for this is 1,461. But note the party analysis for this question involves splitting the sample two ways (by party and preferred supermarket), so the cross-cut sub-samples will be much smaller.
4 I haven’t told you some of the other fun facts to be found in the data, such as that Green and Reform voters are the most avid readers of horoscopes, and Labour voters are the most frequent visitors to the opera and the least likely to do their shopping at the Co-op, while LibDems are the keenest on shopping at Waitrose, but sadly the numbers involved in these cases are so small that we can’t place any reliability on these findings, and thus, as Wittgenstein said, for those things of which we cannot speak, of them we must be silent.
The UK’s major complaints services are receiving increasing numbers of cases to investigate, and the use of generative AI chatbots might be a cause.
How much is generative AI already helping people to assert their legal rights?
Direct research evidence is limited, but one indicator could be that (according to data I’ve obtained) the UK’s main complaints services have seen a recent upsurge in the numbers contacting them.
AI chatbots may be lowering the barriers for ordinary citizens to pursue their grievances over how they’ve been treated by a public authority or commercial company.
On the other hand AI systems are not always used sensibly, while the greater volumes are increasing the demands on those at the receiving end.
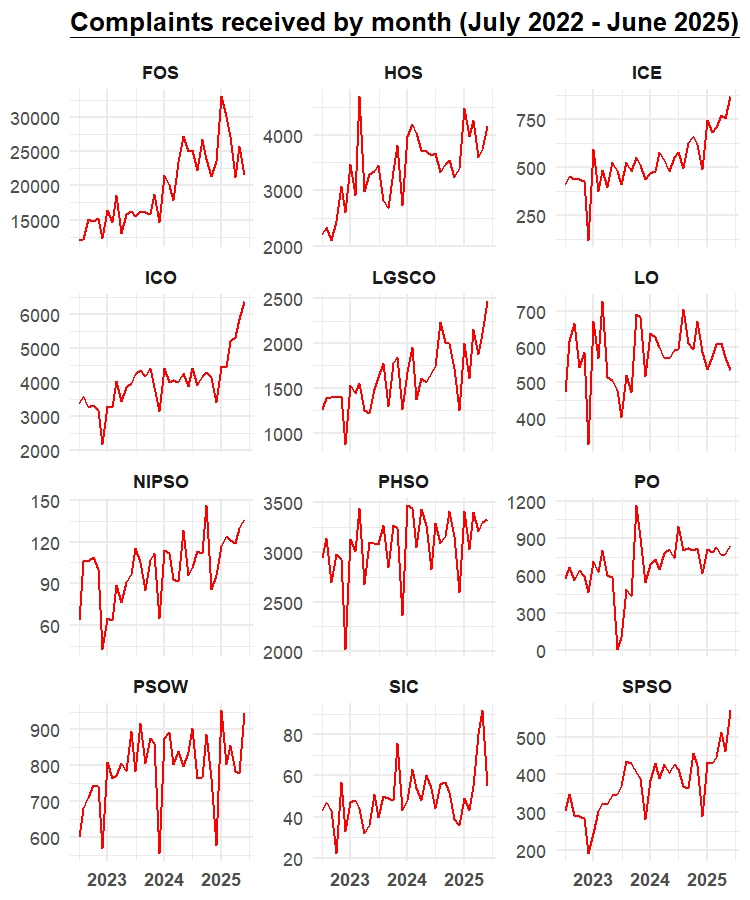
I made FOI requests to establish the monthly figures for new cases over the past three years from a dozen authorities which investigate complaints from members of the public, such as the Financial Ombudsman Service and the Local Government and Social Care Ombudsman.
The charts below show the three-year pattern in the level of complaints they each received per month. (For further explanation see the notes at the end.) There are lots of ups and downs in each case, but a broad overall trend seems clear.
While none of these bodies seems to have conducted a formal analysis of the role of AI in the increases they are facing, anecdotally within the sector there is talk of the rapidly growing use of AI tools as being a major contributory factor.
The same is true within the FOI community, where some practitioners believe AI is boosting requests.
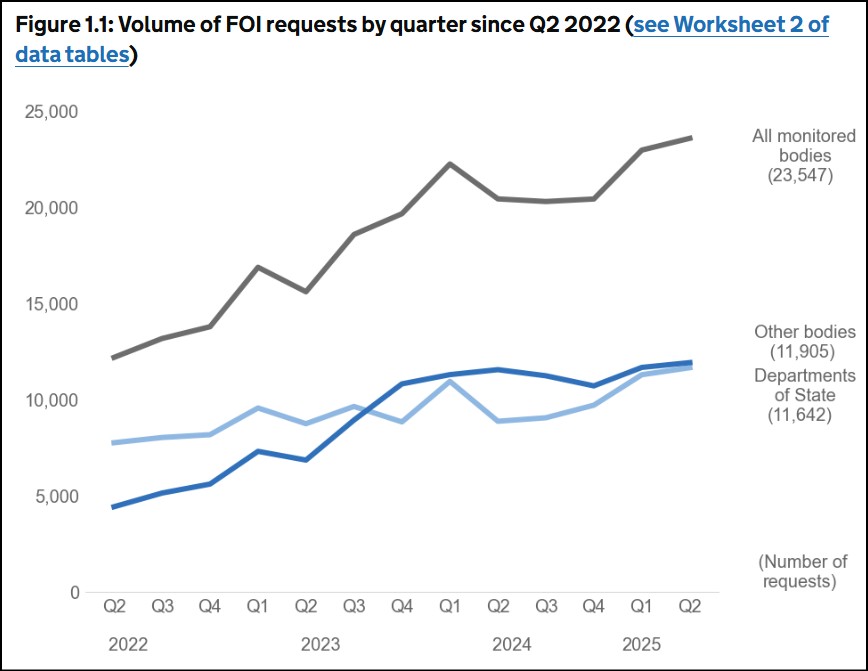
The next chart is taken from the latest government FOI statistics published last week, and shows what has happened to numbers of FOI requests to central government bodies over the past three years.
The evidence of AI playing a role in all this is circumstantial and anecdotal, but in my view it would be surprising if it wasn’t true. If you make something easier for people, and tell them how to do it, they will do it more often. A little experimentation confirms that popular chatbots will explain how best to raise complaints about failings in services and which organisation to direct them to, and conveniently offer to supply a draft or template for use.
While I’m not aware of any similar research in the UK, one American study last year reported that 18 percent of complaints to the US Consumer Financial Protection Bureau had evidence of text generated by an AI large language model.
Nevertheless there could also be other possible causes involved, such as perhaps a more general willingness to complain or more to complain about, as well as the specific factors that would significantly affect individual services.
It seems likely that younger and more tech-savvy citizens would be the earlier adopters. But the US experience suggests that possibly the use of AI in this way is also particularly helpful to people who are less proficient in English.
However the lazy or careless use of AI can hinder rather than help complainants. Last week the Information Commissioner’s Office rather sarcastically rebuked a requester for an internal review application which contained inaccurate statements. The ICO suggested the requester had relied on AI and added: “We advise that any AI generated material is verified before including it in your responses.” (This was spotted by the FOI trainer Tim Turner).
Collating these raw numbers leaves open the question of whether AI-assisted complaints are more or less likely to be effective.
But either way the increased number of complaints may present difficult challenges for these organisations, who will have to cope with the extra workload and prevent the build up of backlogs, possibly without the benefit of extra resources.
In due course AI tools may also help them process complaints more efficiently, in ways that some have already started to develop. However there are serious doubts about both accuracy and public acceptance for automated decision-making.
Notes
Financial Ombudsman Service (FOS) handles consumer complaints about financial services.
Housing Ombudsman Service (HOS) deals with residents’ complaints about social housing in England.
Independent Case Examiner (ICE) reviews certain complaints about state benefits and financial support.
Information Commissioner’s Office (ICO) covers data protection and freedom of information complaints. My chart amalgamates the figures for these two aspects of its work.
Local Government and Social Care Ombudsman (LGSCO) investigates complaints about councils and adult social care in England.
Legal Ombudsman (LO) handles complaints about legal services.
Northern Ireland Public Services Ombudsman (NIPSO) investigates complaints about public bodies in Northern Ireland.
Parliamentary and Health Service Ombudsman (PHSO) deals with complaints about UK government departments and the NHS in England.
Pensions Ombudsman (PO) covers pension schemes. The dramatic blip in the chart for mid-2023 is because for a period its online submission form was not available, followed by a rush of complaints when it returned.
Public Services Ombudsman for Wales (PSOW) handles complaints about Welsh public services.
Scottish Information Commissioner (SIC) covers Scottish freedom of information cases.
Scottish Public Services Ombudsman (SPSO) deals with complaints about Scottish public services. And on a side note, they responded to the FOI request which I submitted at 5pm one day by sending all the requested information at 1030am the next morning – so well done to them for the efficiency of their FOI operation.
Last month the government issued a new policy paper on its plans for reforming electoral law. Some of the proposals stemmed from a strategic review of electoral registration and conduct, which however was not released. But under FOI I have obtained a copy of it from MHCLG and have posted it here. It provides more details on the background and justification for some of the government’s intentions, and contains a substantial section on improving processes (such as postal ballots) for overseas voters, which seems to have been completely ignored.