MRP

Maybe Right, Perhaps

What will be the political impact of the additional challenges that MRP polls may face at the next general election?

Last week’s local election results suggest that we are entering a new phase of multi-party politics across Britain.

Setting aside the local and national policy consequences, the impact will also be to make our elections harder to forecast and to complicate the task of the polling companies.

Yesterday I attended a meeting organised by the British Polling Council to discuss ways of tackling the industry’s failings at the last general election, when the polls significantly over-predicted how well Labour would do.

The next general election is likely to present further difficult challenges for the pollsters, particularly for MRP polls which proliferated in 2024. I think this could have important political ramifications.

The MRPs apply statistical modelling to survey data in order to produce individual constituency forecasts based on the local demography, and thus predict how many seats each party will win. Despite the headline on this piece, it stands for Multilevel Regression and Post-stratification, rather than Maybe Right, Perhaps.

Last year the MRPs made a positive contribution to understanding the pattern of public opinion by correctly showing that Labour and the LibDems would benefit from different swings in different seats, rather than the traditional norm of roughly uniform swing across the country. They were therefore a very useful expansion of polling techniques.

However the MRP polls all exaggerated the level of Labour success, as I have previously analysed. This systematic error across the industry stemmed largely from the voting intention polling figures which were fed into the statistical models.

If, as seems probable, the current electoral fragmentation continues until the next general election, then predicting constituency winners will surely get harder, for the following reasons.

  • There will be many more seats where more than two parties have a realistic chance of coming top.
  • Winning margins will be narrower.
  • Pollsters will have to try to identify demographic characteristics of voters across a greater range of political attitudes.

All this will make forecasts more sensitive to problems with unrepresentative survey samples and any flawed assumptions or procedures in the statistical modelling. It is also likely to produce greater differences in constituency predictions between the various pollsters.

We already saw in 2024 how the MRPs can profoundly affect a campaign. Their forecasts for each seat were relied on by a number of tactical voting websites, and in local electioneering political parties made great use of those estimates which were convenient. The MRPs also probably had a substantial impact on the morale of some party activists, both positively and negatively.

All these points were made at the BPC event yesterday. For example, Martin Baxter from Electoral Calculus described how he received irate complaints about some local parties quoting out-of-date seat analyses in their election literature, but despite his efforts there was nothing practically he could do to stop them.

I expect next time there will be greater variation and inconsistency, with more opportunities for parties to cherry pick and publicise forecasts that suit them. We’ll also see more instances of different tactical voting organisations issuing contradictory advice. Sounds like a recipe for chaos and confusion. And perhaps more calls for polling to be banned during campaigns.

However I should note that one factor will help the MRP statistical modellers at the next election. As Prof Chris Hanretty pointed out yesterday, they won’t have to cope with the complication of new constituency boundaries.

As well as these challenges, the MRPs will also face the fundamental issue that the political polling industry in general does – the accuracy or otherwise of voting intention data.

The major problematic factors in 2024 considered by the BPC’s member companies, as I have reviewed in the past, were late swing, ‘shy Tories’, difficulties with reaching over 75s and the less politically engaged, and religion/ethnicity.

No one knows of course whether next time there will be much late changing of mind by the electorate. Some of the other concerns may be dealt with by more sophisticated demographic modelling and more ingenious or determined ways to survey the kind of voters who aren’t enthusiastic about being polled. But the problem of ‘shy Tories’ may get trickier to handle.

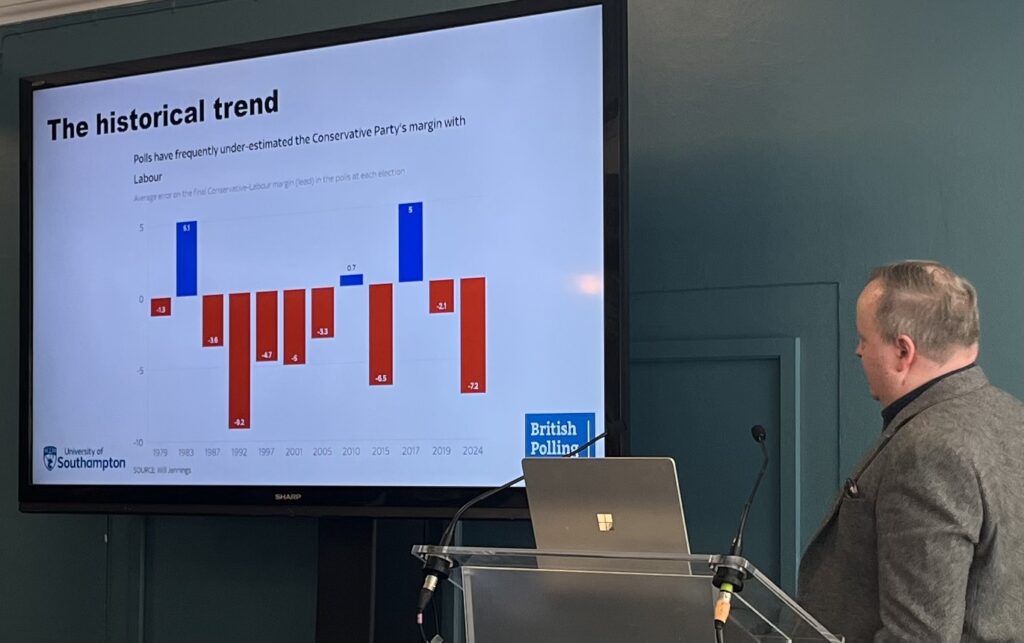
Pollsters historically and internationally have faced a frequent (but not universal) difficulty of under-stating backing for right wing parties (as can be seen in this chart presented by Prof Will Jennings). In the UK most pollsters try to manage this by weighting samples according to how people voted in the past.

Yet at a time of increasing volatility in the electorate, with chunks of public opinion churning around in all sorts of different directions, this is becoming much more awkward than in an era predominantly of neat two-party uniform swing.

This may also leave pollsters with dilemmas, as was illustrated at the meeting by Robert Struthers of BMG Research. Given how age was very strongly associated with voting patterns in 2024, it would surely make sense to take account of mortality and adjust for Tory voters (who tended to be much older) being more likely to die between then and the next election. But if you are already worried that your polling is under-stating Tory support, this would only take you further in the wrong direction.

Prof Patrick Sturgis also raised what could become a growing problem in the world of online survey research, which is that of questionnaires being completed by bots or organised bogus respondents, so that financial or other incentives can be claimed. This could be exacerbated if the fakers increasingly purport to be the hard-to-reach groups that pollsters may be upweighting in analysing samples.

It’s expected that the presentations (which I thought were impressively interesting and candid) given by the polling companies at yesterday’s meeting will be placed on the BPC website, to add to the analyses which are already there. Well done to the BPC, which aims to increase transparency in the UK’s political polling industry, for arranging the event.

The pollsters are continuing to grapple with all these issues. In particular they are awaiting the release of delayed data from the large-scale academic British Election Study, which may shed further light on what went wrong for the industry in 2024.

Maybe Right, Perhaps Read More »

Election prediction models: how they fared

Which predictive model for the results of the election was best – or the least bad?

I say ‘least bad’, because in what may seem like the frequent tradition of the British polling industry, they all overstated how well Labour would do.

However there was also a huge gap between the least bad and the much worse. In a close election discrepancies of this extent would have pointed during the campaign to very different political situations, creating the impression that the forecasting models were contradictory chaos. This level of variation is somewhat disguised by the universal prediction of what could be called a ‘Labour landslide’, now confirmed as fact (even if it isn’t as big as they all said it was going to be).

Labour seats

Let’s look at the forecasts for the total number of Labour seats. This determines the size of Labour’s majority and is the most politically significant single measure of how the electorate voted.

Actual result for Labour seats412
Britain Predicts418
More In Common430
YouGov431
Election Maps432
Economist*433
JL Partners442
Focal Data444
Financial Times447
Electoral Calculus453
Ipsos453
We Think465
Survation**470
Savanta516

I have listed the models which predicted votes for each constituency in Great Britain and were included in the excellent aggregation site produced by Peter Inglesby. (If that means any model is missing which should have been added, my apologies.)

Note that what I am comparing here are the statistical models which aimed to forecast the voting pattern in each seat, not normal opinion polls which only provide national figures for vote share. These competing models are all based on different methodologies, the full details of which are not made public.

The large number of such models was a new feature of this election, linked to the growing adoption of MRP polling along with developments in the techniques and capacity of data science.

On this basis the winner would be the Britain Predicts model devised by Ben Walker and the New Statesman. Well done to them.

This model is not based on a single poll itself, but takes published polling data and mixes it into its analysis. This is also true of some of the others around the middle of the table, such as the Economist and the Financial Times.

On the other hand polling companies like YouGov and Survation base their constituency-level forecasts on their own MRP polls (Multilevel Regression and Post-stratification), combining large samples and statistical modelling to produce forecasts for each seat.

The closest MRP here is the More in Common one, with YouGov narrowly next. However the bottom of the table are also MRP polls rather than mixed models – We Think, Survation and Savanta. (It should be noted that the Savanta one was conducted in the middle of the campaign and so was more vulnerable to late swing).

Constituency predictions

However a different winner emerges from a more detailed examination of the constituency level results. This is based on my analysis using the data aggregated on Peter Inglesby’s website.

Although Britain Predicts was closest for the overall picture, it got 80 individual seats wrong in terms of the winning party. This was often in opposite directions, so at the net level they cancelled each other out. It predicted Labour would win 33 seats that they lost, while also predicting they would lose 26 seats which the party actually won.

In contrast YouGov got the fewest seats with the wrong party winning, just 58. So well done to them. And I’m actually being a bit harsh to YouGov here, as this is counting the 10 seats they predicted as a ‘tie’ as all wrong – on the basis that (a) the outcome wasn’t a tie (haha), and (b) companies shouldn’t get ranked with a better performance via ambiguous forecasts which their competitors avoid. If you do not agree with that, which might be the more measured approach, you can score them at 53.

The two models that did next best at the constituency level were Elections Maps (62 wrong) and the Economist (76 wrong). The worst-scoring models were We Think and Savanta which both got 134 seats wrong.

This table shows the number of constituencies where the model wrongly predicted the winning party.

ModelErrors at seat level
YouGov53
Election Maps62
Economist76
Britain Predicts80
Focal Data80
More in Common83
JL Partners91
Electoral Calculus93
Financial Times93
Ipsos93
Survation100
Savanta134
We Think 134
Source: Analysis by Martin Rosenbaum, using data from Peter Inglesby’s aggregation site.

(I’m here adopting the slightly kinder option for YouGov in the table).

This constituency-level analysis also sheds light on the nature of the forecasting mistakes.

There were some common issues. Generally the models failed to predict the success of the independent candidates who appealed largely to Muslim voters and either won or significantly affected the result. On the one hand it is difficult for nationally structured models to pick up on anomalous constituencies. On the other it is possible that the models typically do not give enough weight to religion (as opposed to ethnicity).

On this point there’s increasing evidence of growing differences in voting patterns between Muslim and Hindu communities. It’s striking that 12 of the 13 models (all except YouGov) wrongly forecast that the Tories would lose Harrow East, a seat with a large Hindu population where the party bucked the trend and actually increased its majority.

The models also failed almost universally to predict quite how badly the SNP would do – ironically with the exception of Savanta, the least accurate model overall.

On the other hand there were also wide variations between the models in terms of where they made mistakes. In all there were 245 seats – 39% of the total – where at least one model forecast the wrong winning party.

The seats that most confused the modellers are as follows.

Seats where all the 13 modellers predicted the wrong winning party: Birmingham Perry Barr, Blackburn, Chingford and Woodford Green, Dewsbury and Batley, Fylde, Harwich and North Essex, Keighley and Ilkley, Leicester East, Leicester South, Staffordshire Moorlands, Stockton West, plus the final seat to declare: Inverness, Skye and West Ross-shire***.

Seats where 12 of the 13 modellers predicted the wrong winning party: Beverley and Holderness, Godalming and Ash, Harrow East, Isle of Wight East, Mid Bedfordshire, North East Hampshire, South Basildon and East Thurrock, The Wrekin.

Overall seats v individual constituency forecasts

So which is more important – to get closest to the overall national picture, or to get most individual seats right?

The statistical modelling processes involved are inherently probabilistic, and it’s assumed they will make some errors on individual seats that will cancel each other out. That’s the case for saying Britain Predicts is the winner.

But if you want confidence that the modelling process is working comparatively accurately, that would point towards getting the most individual seats right – and YouGov.

Note that this analysis is based just on the identity of the winning party in each seat. Comparing the actual against forecast vote shares in each constituency could give a different picture. I haven’t had the time to do that more detailed work yet.

Traditional polling v predictive models

The traditional (non-MRP) polls also substantially overstated the Labour vote share, as the MRP ones did, raising further awkward questions for the polling industry. However, there’s an interesting difference between the potential impact of the traditional polls compared to the predictive models which proliferated at this election.

Without these models, the normal general assumption for translating vote shares into seats would have been uniform national swing. (This would have been in line with the historical norm that turned out to be inapplicable to this election, where Labour and the LibDems benefitted greatly from differential swing patterns across the country.) And seat forecasts reliant on that old standard assumption would then have involved nothing like the massive Labour majorities suggested by the models.

Although the predictive modelling in 2024 universally overstated Labour’s position, it did locate us in broadly the correct political terrain – ‘Labour landslide’. We wouldn’t have been expecting that kind of outcome if we’d only had the traditional polling (even with the way it exaggerated the Labour share).

To that extent the result was some kind of vindication for predictive modelling and its seat-based approach in general, despite the substantial errors. The MRP polls and the models that reflected them succeeded in detecting some crucial differential swings in social/geographic/political segments of the population (while also exaggerating their implications).

However, it’s also possible that the models/polls could in a way have been self-negating predictions. By forecasting such a large Labour victory and huge disaster for the Tories, they could have depressed turnout amongst less committed Labour supporters who then decided not to bother going to the polling station, and/or they could have nudged people over into voting LibDem, Green or independent (or indeed Reform) who were until the end of the campaign intending to back Labour.

Notes

*Note on Economist prediction: Their website gives 427 as a median prediction for Labour seats, but their median predictions for all parties sum up to well short of the total number of GB seats. In my view that would not make a fair comparison. Instead I have used the figure in Peter Inglesby’s summary table, which I assume derives from adding up the individual constituency predictions.

**UPDATE 1: Note on Survation prediction: After initially publishing this piece I was informed that Survation released a very late update to their forecast which cut their prediction for Labour seats from 484 to 470. The initial version of my table used the 484 figure, which I have now replaced with 470. However, despite reducing the extent of their error, this does not affect their position in the table as second last.

Other notes: (1) I haven’t been able to personally check the accuracy of Peter Inglesby’s data, for reasons of time, but I have no reason to doubt it. I should add that I am very grateful to him for his work in bringing all the modelling forecasts together in one place. (2) This article doesn’t take account of the outcome in Inverness, Skye and West Ross-shire, which at the time of writing was yet to declare.

***UPDATE 2: The eventual LibDem victory in Inverness, Skye and West Ross-shire was not predicted by any model, which all forecast the SNP would win. This means that this has to be added to my initial list of those which all the models got wrong, which therefore now totals 12 constituencies.

Election prediction models: how they fared Read More »