Scotland’s alphabet effect
Last week’s local election results appear to confirm how a candidate’s chance of getting elected to Scotland’s councils is dramatically influenced by a factor which is nothing to do with their abilities – alphabetical order of surnames.
This arises from the voting system used for Scottish council elections, the Single Transferable Vote (STV), where voters number candidates in their order of preference.
Parties will stand more than one candidate in a multi-member ward if they think they have a chance of getting more than one elected.
But of course lots of voters, who may have strong preferences between the parties, don’t particularly care about preferring one candidate from within a party to another.
It’s well established that under STV many voters have a tendency to number candidates from the same party just in the order they find them on the ballot paper, which is a major advantage for those listed first. In Scotland that is alphabetical order by surname.
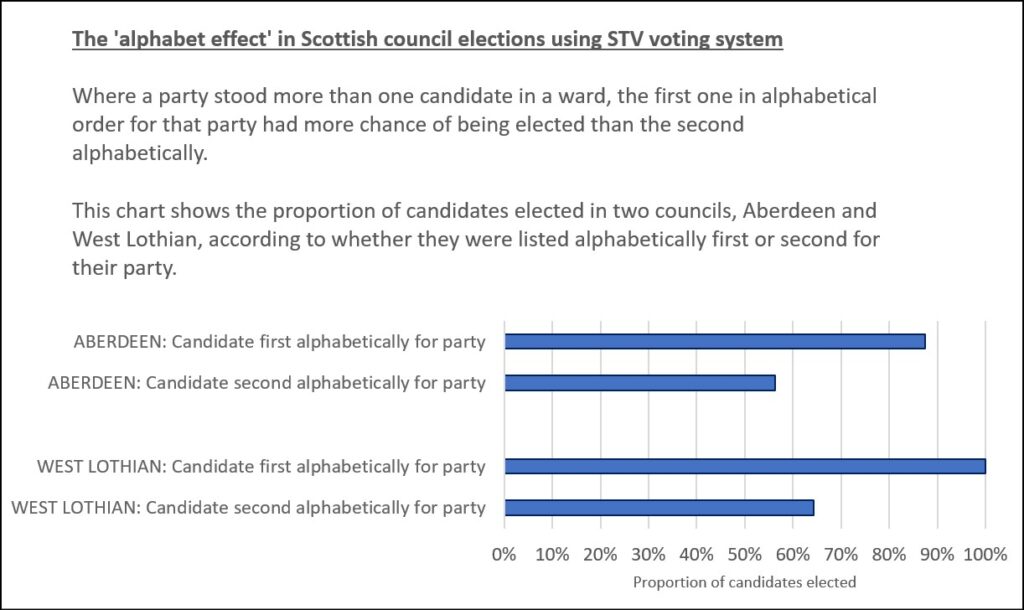
To illustrate the striking extent of this I have looked at what happened last week in two Scottish councils, Aberdeen and West Lothian (the first and last councils alphabetically, in a limited attempt to avoid alphabetical bias in my selection).
I examined all the cases in these two councils where a party stood two or more candidates in one ward.
In West Lothian, there were 14 examples. In 13 of these, the candidate who came first alphabetically from that party got more first preference votes than the candidate listed second alphabetically, sometimes by huge margins.
The candidates listed first alphabetically for a party averaged 1,669 first preference votes; the candidates from the same party listed second alphabetically only averaged 745 first preferences – less than half as much.
The result was that the candidates listed first alphabetically for a party had a 100% success rate at getting elected; the candidates from the same party listed second alphabetically only had a 64% success rate of election.
In Aberdeen, there were 16 examples. In 14 of these, the candidate who came first alphabetically from that party got more first preference votes than the candidate listed second alphabetically, again sometimes by huge margins.
The candidates listed first alphabetically for a party averaged 1,223 first preference votes; the candidates from the same party listed second alphabetically only averaged 554 first preferences – again, less than half as much.
The result here was that the candidates listed first alphabetically for a party had an 88% success rate at getting elected; the candidates from the same party listed second alphabetically only had a 56% success rate of election.
Obviously it would be ideal to do this analysis for all the 32 local authorities in Scotland. But given the different locations and formats in which all the results are published, that would be a very laborious exercise which is too time-consuming for me to do right now. If there was one single national database of all Scottish local election results in a convenient format for exporting data then it would be a lot more feasible! (I also haven’t examined the impact in the very different political circumstances of Northern Ireland).
It seems clear that the current position in Scotland represents a form of institutionalised systemic discrimination. A council seat is often a step towards building a powerful political career on a bigger stage.
In the past the Scottish government has considered various means of ameliorating this situation but has not implemented any change. Potential options would include randomising the ballot paper order or listing candidates in reverse alphabetical order on half the ballot papers.
Parties could counteract the effect if they had loyal, disciplined voters who would order candidates as instructed, with different instructions issued to different subsets of voters. Roughly equalising the number of first preferences would help to get more than one of their candidates elected.
There has been some evidence of alphabetical voting affecting results in English and Welsh elections, but this is to a much lesser extent because of the different voting systems. Alphabetical voting is also an international phenomenon.
And alphabetical bias also exists in other contexts – here’s an interesting paper on its impact in an academic discipline where co-authors of papers were listed alphabetically.
By the way, when drafting this piece I noticed I had automatically defaulted to providing the Aberdeen data before that for West Lothian, so I went back and reversed that. But I did leave Aberdeen first in the chart.
The acceptance of alphabetical order as an apparently natural and unproblematic method may have a deeper and more insidious grip on our minds, and more important consequences, than we may consciously realise.
Scotland’s alphabet effect Read More »