politics

Where did the polls go wrong?

The general election result last July was certainly a ‘Labour landslide’, but it wasn’t the even bigger, ginormous landslide which the polls predominantly predicted.

We were saved from the normal cliched headline ‘Polls Apart’, because the polls were all together on one side of reality, overstating Labour and understating the Tories.

I’ve been examining the reasons provided by those polling companies who have publicly tried to explain how these forecasts went wrong. They focus on the following factors: late swing, religion, turnout, ‘shy Tories’, and age.

The most recent company to publish its analysis was YouGov, which did so just before Christmas, also announcing that it would adopt a new methodology from January.

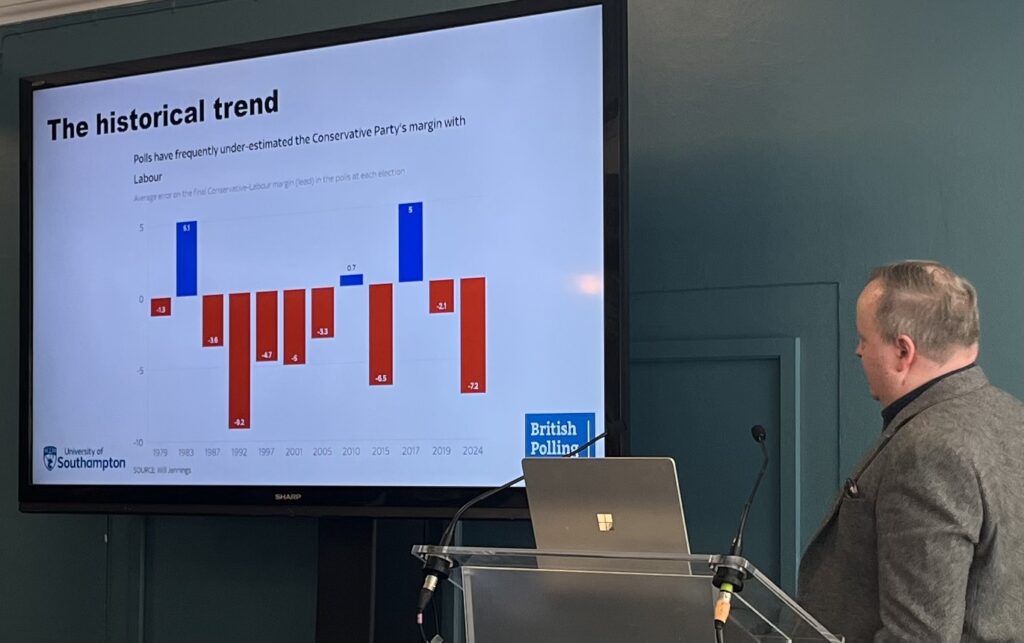
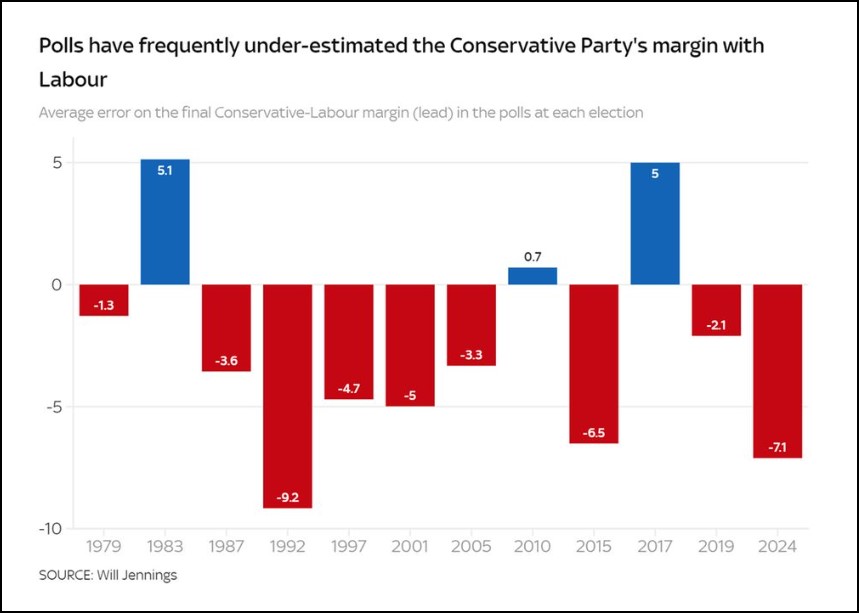
The election polls significantly overestimated Labour and underestimated the Conservatives, as shown in a chart from Will Jennings.

While this pattern has often happened, in terms of the difference between the two parties, this was their biggest miss since 1992, exaggerating the gap on average by 7 percentage points.

The constituency prediction models known as MRP polls were also all awry in the Labour direction, as demonstrated in the dataset collated by Peter Inglesby.

Of course some polls were much nearer to the actual outcome than others, as the companies that did reasonably well and got closest are naturally keen to stress, and as I myself have analysed in the past. But the industry as a whole clearly systematically over-predicted Labour, and that’s not good for the world of opinion research.

This is despite the fact that one can argue this was a tricky election to get right, with an increasingly volatile electorate, a very large swing, an important new party, the impact of independents, and changes in how demographic characteristics such as education and class link to voting behaviour.

If the result had been close, the level of polling error involved would have created a sense of chaos and surely have become a crisis for the industry. However the problem has been disguised by the fact that the only point at issue was the extent of the landslide, and so it did not disturb the central narrative of the election.

Pollsters are constantly seeking to improve their methods, and indeed the MRP models last July were a positive contribution to getting the overall impact correct, confirming the value of innovation. Companies have been reviewing their performance and what went wrong.

The British Polling Council (BPC) is collating relevant research from its members on its website. So far work from six organisations has been added. As well as YouGov, the others are BMG, Electoral Calculus, Find Out Now, More in Common, and Verian. It’s possible that more BPC members will add further submissions in due course.

I’ve been reading them to see what prevailing points emerge on an industry-wide basis.

It is important to note that given the companies have different methodologies, this implies there could also be variations in what each got wrong. But the fact that they were all out in the same pro-Labour/anti-Tory direction suggests that as well as any individual aspects there is also something significant which is shared.

Although there is no unanimity, their findings do reveal some common themes. (None of them discuss the issue of ‘herding’, the claim that error can be exacerbated if some companies sometimes take decisions in such a way that they stay in line with the crowd – a charge which is very unpopular within the industry).

Late swing

Three companies – BMG, More in Common and YouGov – attribute the error partly to ‘late swing’, due to people changing their mind about how to vote at the last minute after final opinion surveying ended. A cynic might say that this is the most convenient excuse for the industry, as it is the least challenging to the accuracy of their methods. Maybe, but the fact that it is convenient doesn’t necessarily mean that it is wrong.

Beyond the data presented, I have to say I also find this plausible based on anecdotal evidence, with the forecasts of a huge Labour victory nudging some intending supporters into eventually switching to vote for someone else, such as the Greens. In this sense the polls ironically could have been their own enemies, almost a kind of partially self-negating prophecy.

However Electoral Calculus finds no evidence of late swing, and in any case none of the companies thinks it can approach the full explanation, which still leaves a methodological challenge for the industry.

Religion/ethnicity

The pollsters seem to have failed to reflect the increasing fragmentation of the ethnic minority electorate, with some Muslim/Pakistani & Bangladeshi voters abandoning Labour, often for independent candidates who campaigned about the situation in Gaza, while Hindu/Indian voters drifted towards the Tories. This factor is referred to by BMG, More in Common and YouGov. It is clear that election analysis can no longer crudely treat voters of Asian heritage (let alone all ethnic minorities) as if they are one political bloc.

More in Common suggests that Muslims who currently take part in online market research panels are probably not representative of the overall Muslim population, being more likely to be second or third generation immigrants, and less likely to be born outside the UK or not speak English. The company says it will probably modify its weighting scheme.

Similarly YouGov says it will incorporate a more detailed ethnicity breakdown into its modelling in future.

However, the numbers of voters involved, while crucial in certain seats, mean that this could also only be a very partial factor nationally.

Turnout

Taking account of likelihood-to-vote is a notoriously difficult problem for pollsters, who employ a range of strategies to estimate how many of each party’s proclaimed supporters will actually go to the trouble of casting a ballot. Three companies – BMG, Electoral Calculus and YouGov – include the overpredicting of Labour voters’ turnout as a factor in the 2024 error.

YouGov argues the cause stemmed from panels which over-represented people who would actually vote, especially for low turnout demographic groups. The company says that from now on it will base turnout modelling purely on demographic data, rather than respondents’ self-reported likelihood-to-vote.

This sort of problem has been a general industry issue in the past, of over-sampling the more politically engaged (who tend to be keener to take part in this kind of survey).

However it is awkward for pollsters to get turnout adjustments correct. There is no guarantee that what worked best last time will be best next time, as the commitment of different groups to implement their asserted voting intentions may depend on the political circumstances of the moment. Ironically again, the forecast Labour triumph last July might have pushed some of the party’s less determined supporters into not bothering to go to the polling station on the big day.

Shy Tories

This has also been a traditional difficulty for the polling industry, where those of a Conservative outlook are somewhat less willing to express their allegiance – possibly because they feel in some sense disapproved of or intimidated (this is sometimes called ‘social desirability bias’), or perhaps alienated from polls. Again, the extent to which it happens can also depend on the political atmosphere of the time.

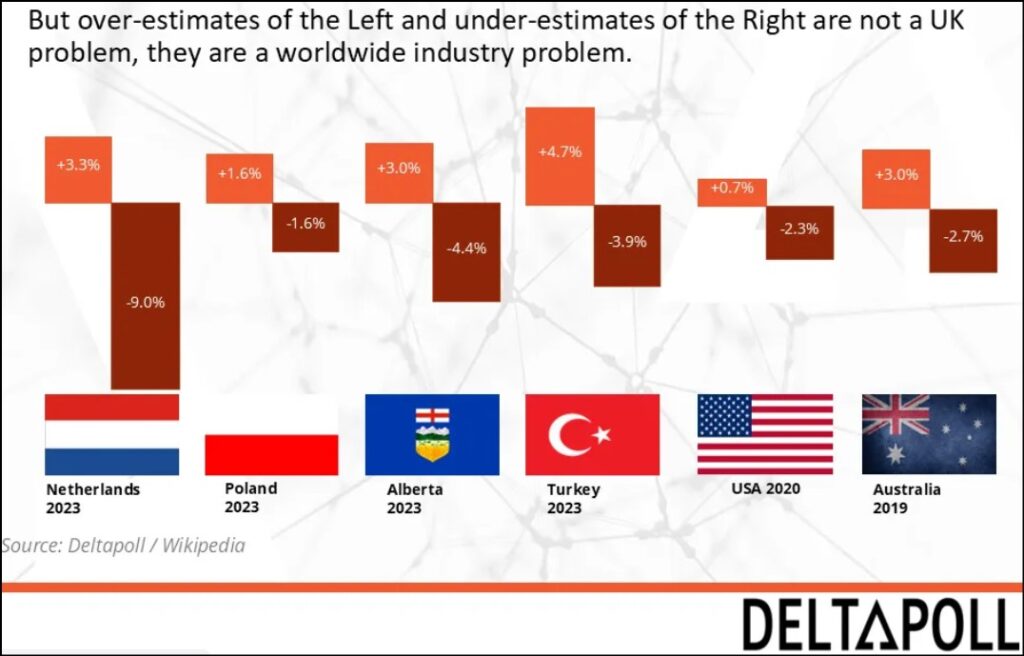
Over-estimating the Left and under-estimating the Right is not just a UK polling problem – it has cropped up as a fairly consistent (but not universal) pattern across many countries, as can be seen in the Deltapoll slide in this piece by Mark Pack.

The industry has tried to counteract this skew through various means of political weighting, such as using previous voting behaviour.

Electoral Calculus states there is indeed suggestive evidence of a ‘shy Tory’ effect in 2024, with people who refused to answer voting intention questions or who replied “don’t know” being more likely to be Tory voters. This is also consistent with the findings reported by BMG and by More in Common about ‘undecided’ voters who were then pressed.

YouGov suggests that its past vote weighting fell down in 2024 because at the previous election in 2019 the Brexit Party endorsed the Conservatives in many seats. The result was that its panels had too many 2019 Tories who actually preferred the Brexit Party and then voted Reform in 2024, and not enough firmly committed Conservatives. Their paper does not raise the issue of whether it is staunch Tories who are most likely to avoid voting intention opinion research, but it seems to me that this conclusion is compatible with their evidence.

Find Out Now (which only produced one unpublished poll during the 2024 campaign) argues against the ‘shy Tory’ hypothesis. But in my opinion their data only counters the hypothesis that online research panels under-represent Tories in general, as opposed to the hypothesis (advanced by Electoral Calculus) that Tories may be reasonably represented in panels but are disproportionately likely to refuse or reply “don’t know” when faced with a voting intention question in a survey.

More in Common also states that there is possible selection bias affecting online panels as the recruitment processes appeal to the ‘overly opinionated’.

Age

Age was very strongly associated with how people voted last July, with Tory support concentrated in the older section of the electorate.

The report from Verian (the polling company which came closest to the actual result on percentage vote shares) focuses entirely on the issue of age, and concludes that those companies whose samples contained a smaller proportion of over-65s (after weighting) tended to be less accurate. But its presentation adds that other biases would also have played a role.

Find Out Now raises a different possibility on age, that it failed to locate Conservatives who were younger and less politically engaged (a group that is hard for pollsters to reach).

Summary

At this stage we are left with the suggestion that perhaps four or five factors may have contributed together to the polling miss, and none explain it alone.

There can be a problem with this kind of analysis, dubbed the “Orient Express” approach by Electoral Calculus, where multiple possible causes are examined and all those which affect the error are deemed part of the solution. In other words, as in the Agatha Christie story, if everyone/everything is responsible for what happened, then eventually no one/nothing is actually held responsible, and nothing is done.

On the other hand, looking at the underlying fundamentals, it seems to me that predictive opinion polling is a difficult business given the level of precision required and the volatility of today’s voters. There are many sources of potential error (apart from normal sampling variation), arising from which people get contacted, whether they reply or tell the truth or change their minds later, how the electorate is modelled, and how the answers from different groups are weighted to aim at representativeness. And errors that arise are difficult to eliminate methodologically, as they depend on political circumstances which vary from one election to the next, and also on the communications technology for conducting research which is constantly evolving and in different ways for different social groups.

Inevitably therefore pollsters are bound to make some mistakes (and not all will make the same ones). When they are lucky, the errors may cancel themselves out, more or less, and nobody notices them. When the pollsters are unlucky, the errors largely or entirely mount up in the same direction.

Further, more thorough analysis will be possible once detailed data becomes available from the academic British Election Study and its extensive voter research.

The British Polling Council, to which all the main pollsters belong, is also planning to hold a public event to discuss these issues, probably in April.

Where did the polls go wrong? Read More »

Election prediction models: how they fared

Which predictive model for the results of the election was best – or the least bad?

I say ‘least bad’, because in what may seem like the frequent tradition of the British polling industry, they all overstated how well Labour would do.

However there was also a huge gap between the least bad and the much worse. In a close election discrepancies of this extent would have pointed during the campaign to very different political situations, creating the impression that the forecasting models were contradictory chaos. This level of variation is somewhat disguised by the universal prediction of what could be called a ‘Labour landslide’, now confirmed as fact (even if it isn’t as big as they all said it was going to be).

Labour seats

Let’s look at the forecasts for the total number of Labour seats. This determines the size of Labour’s majority and is the most politically significant single measure of how the electorate voted.

Actual result for Labour seats412
Britain Predicts418
More In Common430
YouGov431
Election Maps432
Economist*433
JL Partners442
Focal Data444
Financial Times447
Electoral Calculus453
Ipsos453
We Think465
Survation**470
Savanta516

I have listed the models which predicted votes for each constituency in Great Britain and were included in the excellent aggregation site produced by Peter Inglesby. (If that means any model is missing which should have been added, my apologies.)

Note that what I am comparing here are the statistical models which aimed to forecast the voting pattern in each seat, not normal opinion polls which only provide national figures for vote share. These competing models are all based on different methodologies, the full details of which are not made public.

The large number of such models was a new feature of this election, linked to the growing adoption of MRP polling along with developments in the techniques and capacity of data science.

On this basis the winner would be the Britain Predicts model devised by Ben Walker and the New Statesman. Well done to them.

This model is not based on a single poll itself, but takes published polling data and mixes it into its analysis. This is also true of some of the others around the middle of the table, such as the Economist and the Financial Times.

On the other hand polling companies like YouGov and Survation base their constituency-level forecasts on their own MRP polls (Multilevel Regression and Post-stratification), combining large samples and statistical modelling to produce forecasts for each seat.

The closest MRP here is the More in Common one, with YouGov narrowly next. However the bottom of the table are also MRP polls rather than mixed models – We Think, Survation and Savanta. (It should be noted that the Savanta one was conducted in the middle of the campaign and so was more vulnerable to late swing).

Constituency predictions

However a different winner emerges from a more detailed examination of the constituency level results. This is based on my analysis using the data aggregated on Peter Inglesby’s website.

Although Britain Predicts was closest for the overall picture, it got 80 individual seats wrong in terms of the winning party. This was often in opposite directions, so at the net level they cancelled each other out. It predicted Labour would win 33 seats that they lost, while also predicting they would lose 26 seats which the party actually won.

In contrast YouGov got the fewest seats with the wrong party winning, just 58. So well done to them. And I’m actually being a bit harsh to YouGov here, as this is counting the 10 seats they predicted as a ‘tie’ as all wrong – on the basis that (a) the outcome wasn’t a tie (haha), and (b) companies shouldn’t get ranked with a better performance via ambiguous forecasts which their competitors avoid. If you do not agree with that, which might be the more measured approach, you can score them at 53.

The two models that did next best at the constituency level were Elections Maps (62 wrong) and the Economist (76 wrong). The worst-scoring models were We Think and Savanta which both got 134 seats wrong.

This table shows the number of constituencies where the model wrongly predicted the winning party.

ModelErrors at seat level
YouGov53
Election Maps62
Economist76
Britain Predicts80
Focal Data80
More in Common83
JL Partners91
Electoral Calculus93
Financial Times93
Ipsos93
Survation100
Savanta134
We Think 134
Source: Analysis by Martin Rosenbaum, using data from Peter Inglesby’s aggregation site.

(I’m here adopting the slightly kinder option for YouGov in the table).

This constituency-level analysis also sheds light on the nature of the forecasting mistakes.

There were some common issues. Generally the models failed to predict the success of the independent candidates who appealed largely to Muslim voters and either won or significantly affected the result. On the one hand it is difficult for nationally structured models to pick up on anomalous constituencies. On the other it is possible that the models typically do not give enough weight to religion (as opposed to ethnicity).

On this point there’s increasing evidence of growing differences in voting patterns between Muslim and Hindu communities. It’s striking that 12 of the 13 models (all except YouGov) wrongly forecast that the Tories would lose Harrow East, a seat with a large Hindu population where the party bucked the trend and actually increased its majority.

The models also failed almost universally to predict quite how badly the SNP would do – ironically with the exception of Savanta, the least accurate model overall.

On the other hand there were also wide variations between the models in terms of where they made mistakes. In all there were 245 seats – 39% of the total – where at least one model forecast the wrong winning party.

The seats that most confused the modellers are as follows.

Seats where all the 13 modellers predicted the wrong winning party: Birmingham Perry Barr, Blackburn, Chingford and Woodford Green, Dewsbury and Batley, Fylde, Harwich and North Essex, Keighley and Ilkley, Leicester East, Leicester South, Staffordshire Moorlands, Stockton West, plus the final seat to declare: Inverness, Skye and West Ross-shire***.

Seats where 12 of the 13 modellers predicted the wrong winning party: Beverley and Holderness, Godalming and Ash, Harrow East, Isle of Wight East, Mid Bedfordshire, North East Hampshire, South Basildon and East Thurrock, The Wrekin.

Overall seats v individual constituency forecasts

So which is more important – to get closest to the overall national picture, or to get most individual seats right?

The statistical modelling processes involved are inherently probabilistic, and it’s assumed they will make some errors on individual seats that will cancel each other out. That’s the case for saying Britain Predicts is the winner.

But if you want confidence that the modelling process is working comparatively accurately, that would point towards getting the most individual seats right – and YouGov.

Note that this analysis is based just on the identity of the winning party in each seat. Comparing the actual against forecast vote shares in each constituency could give a different picture. I haven’t had the time to do that more detailed work yet.

Traditional polling v predictive models

The traditional (non-MRP) polls also substantially overstated the Labour vote share, as the MRP ones did, raising further awkward questions for the polling industry. However, there’s an interesting difference between the potential impact of the traditional polls compared to the predictive models which proliferated at this election.

Without these models, the normal general assumption for translating vote shares into seats would have been uniform national swing. (This would have been in line with the historical norm that turned out to be inapplicable to this election, where Labour and the LibDems benefitted greatly from differential swing patterns across the country.) And seat forecasts reliant on that old standard assumption would then have involved nothing like the massive Labour majorities suggested by the models.

Although the predictive modelling in 2024 universally overstated Labour’s position, it did locate us in broadly the correct political terrain – ‘Labour landslide’. We wouldn’t have been expecting that kind of outcome if we’d only had the traditional polling (even with the way it exaggerated the Labour share).

To that extent the result was some kind of vindication for predictive modelling and its seat-based approach in general, despite the substantial errors. The MRP polls and the models that reflected them succeeded in detecting some crucial differential swings in social/geographic/political segments of the population (while also exaggerating their implications).

However, it’s also possible that the models/polls could in a way have been self-negating predictions. By forecasting such a large Labour victory and huge disaster for the Tories, they could have depressed turnout amongst less committed Labour supporters who then decided not to bother going to the polling station, and/or they could have nudged people over into voting LibDem, Green or independent (or indeed Reform) who were until the end of the campaign intending to back Labour.

Notes

*Note on Economist prediction: Their website gives 427 as a median prediction for Labour seats, but their median predictions for all parties sum up to well short of the total number of GB seats. In my view that would not make a fair comparison. Instead I have used the figure in Peter Inglesby’s summary table, which I assume derives from adding up the individual constituency predictions.

**UPDATE 1: Note on Survation prediction: After initially publishing this piece I was informed that Survation released a very late update to their forecast which cut their prediction for Labour seats from 484 to 470. The initial version of my table used the 484 figure, which I have now replaced with 470. However, despite reducing the extent of their error, this does not affect their position in the table as second last.

Other notes: (1) I haven’t been able to personally check the accuracy of Peter Inglesby’s data, for reasons of time, but I have no reason to doubt it. I should add that I am very grateful to him for his work in bringing all the modelling forecasts together in one place. (2) This article doesn’t take account of the outcome in Inverness, Skye and West Ross-shire, which at the time of writing was yet to declare.

***UPDATE 2: The eventual LibDem victory in Inverness, Skye and West Ross-shire was not predicted by any model, which all forecast the SNP would win. This means that this has to be added to my initial list of those which all the models got wrong, which therefore now totals 12 constituencies.

Election prediction models: how they fared Read More »

Scotland’s alphabet effect

Last week’s local election results appear to confirm how a candidate’s chance of getting elected to Scotland’s councils is dramatically influenced by a factor which is nothing to do with their abilities – alphabetical order of surnames.

This arises from the voting system used for Scottish council elections, the Single Transferable Vote (STV), where voters number candidates in their order of preference.

Parties will stand more than one candidate in a multi-member ward if they think they have a chance of getting more than one elected.

But of course lots of voters, who may have strong preferences between the parties, don’t particularly care about preferring one candidate from within a party to another.

It’s well established that under STV many voters have a tendency to number candidates from the same party just in the order they find them on the ballot paper, which is a major advantage for those listed first. In Scotland that is alphabetical order by surname.

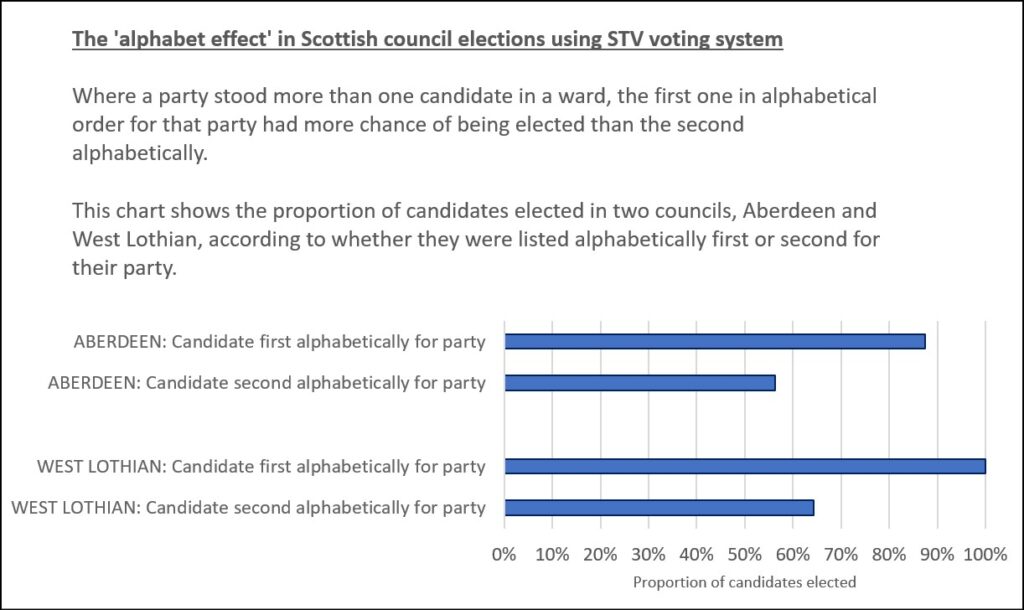
To illustrate the striking extent of this I have looked at what happened last week in two Scottish councils, Aberdeen and West Lothian (the first and last councils alphabetically, in a limited attempt to avoid alphabetical bias in my selection).

I examined all the cases in these two councils where a party stood two or more candidates in one ward.

In West Lothian, there were 14 examples. In 13 of these, the candidate who came first alphabetically from that party got more first preference votes than the candidate listed second alphabetically, sometimes by huge margins.

The candidates listed first alphabetically for a party averaged 1,669 first preference votes; the candidates from the same party listed second alphabetically only averaged 745 first preferences – less than half as much.

The result was that the candidates listed first alphabetically for a party had a 100% success rate at getting elected; the candidates from the same party listed second alphabetically only had a 64% success rate of election.

In Aberdeen, there were 16 examples. In 14 of these, the candidate who came first alphabetically from that party got more first preference votes than the candidate listed second alphabetically, again sometimes by huge margins.

The candidates listed first alphabetically for a party averaged 1,223 first preference votes; the candidates from the same party listed second alphabetically only averaged 554 first preferences – again, less than half as much.

The result here was that the candidates listed first alphabetically for a party had an 88% success rate at getting elected; the candidates from the same party listed second alphabetically only had a 56% success rate of election.

Obviously it would be ideal to do this analysis for all the 32 local authorities in Scotland. But given the different locations and formats in which all the results are published, that would be a very laborious exercise which is too time-consuming for me to do right now. If there was one single national database of all Scottish local election results in a convenient format for exporting data then it would be a lot more feasible! (I also haven’t examined the impact in the very different political circumstances of Northern Ireland).

It seems clear that the current position in Scotland represents a form of institutionalised systemic discrimination. A council seat is often a step towards building a powerful political career on a bigger stage.

In the past the Scottish government has considered various means of ameliorating this situation but has not implemented any change. Potential options would include randomising the ballot paper order or listing candidates in reverse alphabetical order on half the ballot papers.

Parties could counteract the effect if they had loyal, disciplined voters who would order candidates as instructed, with different instructions issued to different subsets of voters. Roughly equalising the number of first preferences would help to get more than one of their candidates elected.

There has been some evidence of alphabetical voting affecting results in English and Welsh elections, but this is to a much lesser extent because of the different voting systems. Alphabetical voting is also an international phenomenon.

And alphabetical bias also exists in other contexts – here’s an interesting paper on its impact in an academic discipline where co-authors of papers were listed alphabetically.

By the way, when drafting this piece I noticed I had automatically defaulted to providing the Aberdeen data before that for West Lothian, so I went back and reversed that. But I did leave Aberdeen first in the chart.

The acceptance of alphabetical order as an apparently natural and unproblematic method may have a deeper and more insidious grip on our minds, and more important consequences, than we may consciously realise.

Scotland’s alphabet effect Read More »

What I learnt from betting on politics

Starting with Tory leadership elections …

For a couple of years in an earlier phase of my life I gambled on politics. And I made money by doing so.

It all began with a Tory leadership election, and what turned out to be the sadly erroneous views of ITN’s then political editor. That was 1995.

I stopped after I joined the BBC in 1998, since it could have created a conflict of interest – which also prevented me taking up a consultancy role I was offered by the betting company Sporting Index to advise on political bets.

So it wasn’t a long phase, but the benefits to me were not only financial – I learnt life lessons from gambling.

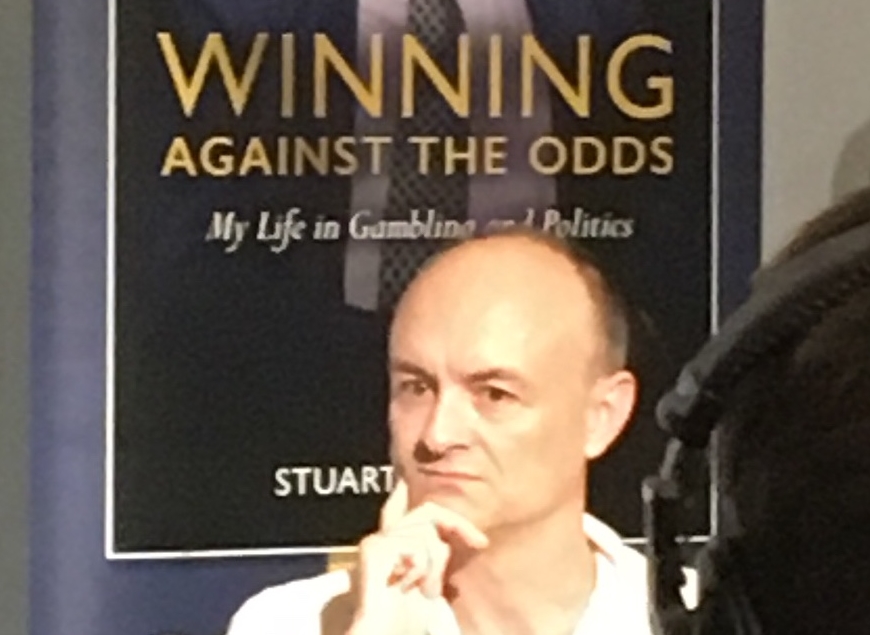
Dominic Cummings and “Winning Against the Odds”

Betting involves taking specific decisions which have plainly identifiable consequences, sometimes very soon. You get a reality check on your opinions and mode of thinking. This means it should provide good opportunities for clear ‘feedback’, both positive and negative, for learning and improving.

I largely focused on spread betting, where decisions could easily have significant financial consequences, for good or ill. I wasn’t betting for ‘fun’, or to buy extra interest or excitement in events, or to hedge or reinforce my emotional reaction to what happened politically, all of which could be rational reasons for risking (or squandering) a few pounds. My aim was purely to win money.

(An explainer on spread betting, for those who want it: Suppose for example a betting company offers a ‘spread’ of 340-350 for the number of seats the Tories will win at the next election. If you think they’ll get more, you can ‘buy’ at 350 at a stipulated stake per seat, say £20. If the Tories then get eg 375 seats you’d win (375-350)x20 = £500; but if they got eg 335 seats you’d lose (350-335)x20 = £300. On the other hand, if you were predicting they’d get 335, you could ‘sell’ at 340 and if right in due course make (340-335)x20 = £100; but if they got 375 you’d lose (375-340)x20 = £700.)

Lesson 1 – It’s in the detail

I became intrigued in betting when John Major, then a beleaguered prime minister, told his many internal party critics to “put up or shut up”, and John Redwood went for the “put up” option. Which led to the 1995 Tory leadership contest.

I was watching the ITN lunchtime news on the day of the ballot, and its political editor Michael Brunson said Redwood would get about 45 votes. I thought “If it’s good enough for Michael Brunson, it’s good enough for me”, and phoned a spread betting company. Later that day it was announced Redwood got 89 votes and I lost £150.

Yet what I gained was the insight that money could be made – but it needed my own careful analysis, not a reliance on the views of others.

And this meant: no general impressions, no broad judgments – that’s more or less plucking figures out of thin air. Instead break the factors of a situation (eg the Conservative parliamentary party) down into component parts and look for whatever detailed evidence exists.

In due course in the 1997 Tory leadership election I made over 20 times what I’d lost on the 1995 one.

Lesson 2 – Opinions and decisions aren’t the same

I learnt how big the difference is between holding an opinion and actually being willing to stake your money on it. When I was deciding whether to place a bet, and I forced myself to think through properly whether the evidence really supported a view I held, I then realised that maybe it didn’t. And this sometimes applied even when I’d previously been enthusiastically advocating that viewpoint in conversation with others.

There was no need to bet on an outcome just because I’d confidently told everybody that it was what I expected to happen. I learnt a healthy disrespect for my own judgment. It’s fine to enjoy a good argument if you want, but when it comes to decision-making with real consequences it might be better to be non-committal.

Lesson 3 – The status quo is always changing

There’s a new status quo with each decision you take.

Sometimes it was possible to guarantee smallish wins by what is called arbitrage. When on some event two betting companies had different spreads which did not overlap, and you spotted it before one of them closed the gap, you could guarantee profit by selling with one and buying with another.

For example: If for Labour seats at the next election company A quoted 320-330 and company B quoted 333-343, you could buy with A at 330 and sell with B at 333 – and if you did that at say £10 per seat, you’d make £30 for sure, irrespective of the actual outcome.

Sometimes arbitrage opportunities were implied rather than being so explicit, and the bookies might not spot and stop these so readily. I can remember in the 1997 general election there were spreads available on the number of Labour MPs and on the number of women MPs which were way out of line with each other, given how many Labour candidates in marginals were women and therefore how tightly the two spreads should have moved together.

This was before online gambling, so you had to make phone calls to place the bets, which took a little time. I reckoned the safest course of action for arbitrage was first to place the bet which represented value in my way of thinking; then place the counterpart bet assuming it was still available.

But once I had placed the first bet I was in a new situation, and in fact one I was quite happy with – I was sitting on a bet that I felt at the time was good value. Why on earth would I want to now go and place another bet that to my mind was probably chucking money away? Well, I didn’t, so I now realised. I went through this process a couple of times and concluded this kind of arbitrage didn’t work for me (it would of course be different in another field where I was ignorant and had no idea which bet actually represented good value).

In other words I’d planned a multi-step strategy based on the situation I was in initially. But once I’d taken the first step, I was in a new situation where the rest of that strategy no longer made sense.

Lesson 4 – Going against the herd, when the herd is wrong

Success can come from spotting when the herd is wrong, when everyone else is heading in the wrong direction – in gambling and in life. You can make money and the bookies can make money, as long as other punters are losing.

I realised that one aspect of the bookies’ talents was to price bets not always in line with predicted outcomes but so that people would go for them.

Shortly before a budget someone from a spread company told me they were thinking of opening a market on how often the chancellor would be interrupted during his speech and asked what I thought. I informed him it would almost certainly be none at all, since that was the established norm for a budget. I was then surprised to see they put up a spread of 2-4 interruptions.

When I spoke to him a few days after the budget, I asked in puzzlement why they’d done this, when people who knew parliamentary convention could take money off them by selling at 2. He explained that it had worked really well, they’d had few sellers at 2 but lots of people buying at 4 who therefore lost money – including a minor TV celebrity of the time who had bought at £1,000 per interruption, losing £4,000.

Lesson 5 – Life looks leptokurtic

Life is uncertain, and genuinely unpredictable events happen. You could lose money on decisions which on the basis of the information you had at the time were probably correct. And sometimes I thought I did. Equally well, you could win on the basis of decisions which actually were probably wrong. Doubtless I did that too.

Perhaps this is particularly applicable to politics. According to a recent data journalism newsletter from the Economist magazine (it’s called ‘Off the Charts’, it’s always interesting and I’d recommend signing up for it), forecasting accuracy from a range of sources is worse about politics than for other human endeavours such as sport or culture.

Maybe – I’m not sure if that’s true or not. But I did increasingly form the view that the probability distribution of human events was fat-tailed. Weird things happened, more often than they should. In statistical terms, there’s a case for saying that life is leptokurtic.

As they say, the race is not always to the swift, and while logic may suggest that’s where to put your money, it’s funny how often in politics it turns out that the tortoise beats the hare.

It’s a case of “winning against the odds”.

What I learnt from betting on politics Read More »